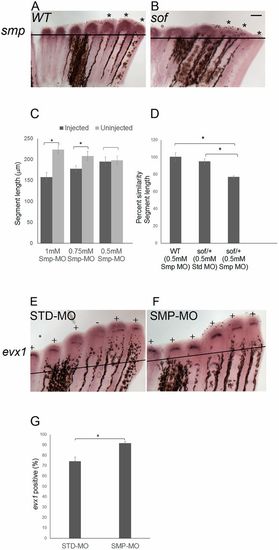
smp and cx43 function in a common pathway to influence evx1 expression. (A) Wild-type and (B) sofb123 fins were amputated at 50% and permitted to regenerate for 87 h. At 87 hpa, the fins were harvested and processed for smp whole-mount in situ hybridization. Asterisks represent the expression domains of smp in each of the three fin rays. Three independent trials were performed (n=18 per genotype). (C) Smp-MO concentrations of 1 mM (n=6), 0.75 mM (n=6) and 0.5 mM (n=11) were used to identify the subthreshold concentration. The 0.5 mM concentration of Smp-MO was selected as the subthreshold dose, as there is no significant decrease in the segment length. The data did not differ significantly from normality (Shapiro-Wilk's test, P>0.05). Error bars represent s.e.m. Student's t-test was performed to test for significance (two-tailed and unpaired, *P<0.05). (D) Synergistic effects of the 0.5 mM dose of Smp-MO with sofb123 heterozygotes (n=10) are revealed compared with either wild-type fins (n=11) injected with 0.5 mM Smp-MO or with sofb123/+ heterozygotes injected with STD-MO (n=7). The data do not differ significantly from normality (Shapiro-Wilk's test, P>0.05). Error bars represent s.e.m. Student's t-test was performed to test for significance (two-tailed and unpaired, *P<0.05). (E,F) Whole-mount in situ hybridization shows that the frequency of evx1 expression is increased in Smp-MO fins (n=21 fins) compared with the STD-MO fins (n=22 fins) (three biological replicates). All fin rays across the fins were injected with Smp-MO or STD-MO at 72 hpa and harvested at 87 hpa. Plus indicates fin rays positive for evx1; minus indicates fin rays negative for evx1. (G) The Smp-MO fins show an increased frequency of evx1-positive fin rays compared with STD-MO injected fins. The data did not differ significantly from normality (Shapiro-Wilk's test, P>0.05). Error bars represent s.e.m. Student's t-test was performed to test for significance (two-tailed and unpaired, *P<0.05). Scale bar: 50 μm.
|
