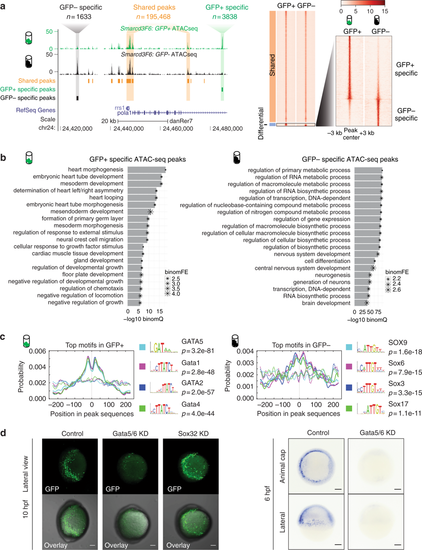
Open chromatin landscape of Smarcd3-F6 labeled population. a Genome browser view and heatmap showing ATAC-seq peaks shared between GFP+ and GFP− populations or enriched in one population. In the heatmap, read intensity for regions within 3 kb of the peak center was plotted for each peak. b Barplot showing the 20 most enriched GO biological function terms obtained from GFP+ /− specific peaks using GREAT analysis. c Probabilities of the top 4 enriched motifs within the GFP+ /− specific peaks calculated by CentriMo76. Each curve shows the probability of the best match to a given motif occurring at a given position in the input sequences. Solid lines represent probabilities calculated from query peak sets (GFP+ /− specific peaks) while dash lines show that from the background sequences (shared peaks). d (Left) Confocal images of native GFP expression in control (uninjected), Gata5/6 KD (injected with Gata5/6 morpholinos) and Sox32 KD (injected with CAS morpholino) Tg(Smarcd3-F6: EGFP) transgenic embryos at 10 hpf; (Right) gfp in-situ on Tg(Smarcd3-F6: EGFP) embryos of 6 hpf that were uninjected (control) or injected with Gata5/6 morpholinos. All staining and imaging were performed under the same condition for the control and KD groups. All scale bars represent 100 μm
|
