
FIGURE
Fig. 4
- ID
- ZDB-FIG-190108-14
- Publication
- Manghnani et al., 2018 - Visualizing Photodynamic Therapy in Transgenic Zebrafish Using Organic Nanoparticles with Aggregation-Induced Emission
- Other Figures
- All Figure Page
- Back to All Figure Page
Fig. 4
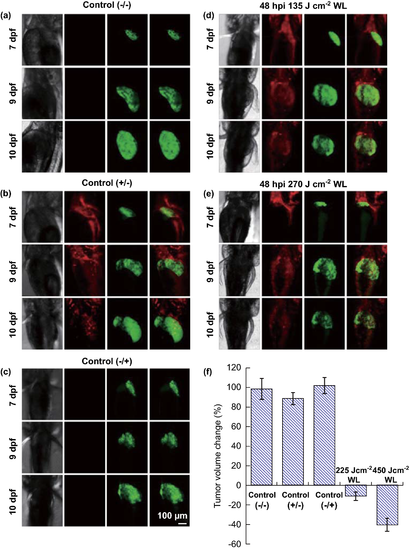
Change in liver tumor volume for control group: a without injection or illumination (−/−), b with injection and without illumination (−/+) and c without injection and with illumination (+/−). Change in liver tumor volume for group injected with NPs on 7 dpf and treated: d with 135 J cm−2 of illumination 9 dpf and e with 270 J cm−2 of illumination of 9 dpf. f Graph depicting the percentage of tumor volume change on 10 dpf relative to the volume on 9 dpf before light treatment for all five groups, n = 14; confocal λex = 488 nm, green fluorescent protein λem = 509 nm, PPDCT λem = 660 nm |
Expression Data
Expression Detail
Antibody Labeling
Phenotype Data
Phenotype Detail
Acknowledgments
This image is the copyrighted work of the attributed author or publisher, and
ZFIN has permission only to display this image to its users.
Additional permissions should be obtained from the applicable author or publisher of the image.
Full text @ Nanomicro Lett