
- Title
-
Visualizing Photodynamic Therapy in Transgenic Zebrafish Using Organic Nanoparticles with Aggregation-Induced Emission
- Authors
- Manghnani, P.N., Wu, W., Xu, S., Hu, F., Teh, C., Liu, B.
- Source
- Full text @ Nanomicro Lett
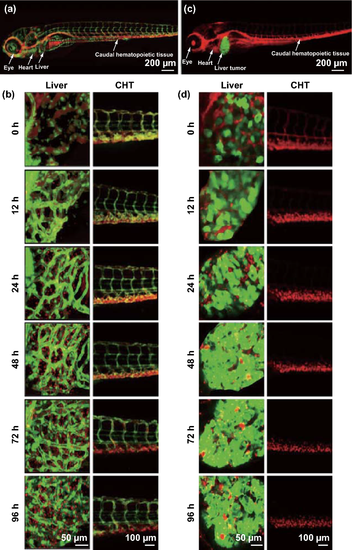
a Confocal image of fli:EGFP zebrafish larva injected intravenously with 0.8 mg mL−1 PPDCT NPs. b Uptake and breakdown of NPs over time span of 96 h in the liver and caudal hematopoietic tissue (CHT) of fli:EGFP zebrafish liver. c Confocal image of EGFP:krasV12 zebrafish larva injected intravenously with 0.8 mg mL−1 PPDCT NPs. d Uptake and breakdown of NPs over time span of 96 h in the liver and CHT of EGFP:krasV12 zebrafish liver. Confocal λex = 488 nm, green fluorescent protein λem = 509 nm, PPDCT λem = 660 nm |
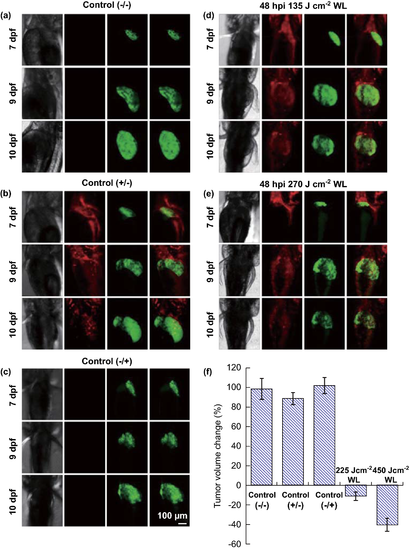
Change in liver tumor volume for control group: a without injection or illumination (−/−), b with injection and without illumination (−/+) and c without injection and with illumination (+/−). Change in liver tumor volume for group injected with NPs on 7 dpf and treated: d with 135 J cm−2 of illumination 9 dpf and e with 270 J cm−2 of illumination of 9 dpf. f Graph depicting the percentage of tumor volume change on 10 dpf relative to the volume on 9 dpf before light treatment for all five groups, n = 14; confocal λex = 488 nm, green fluorescent protein λem = 509 nm, PPDCT λem = 660 nm |