
Fig. S7
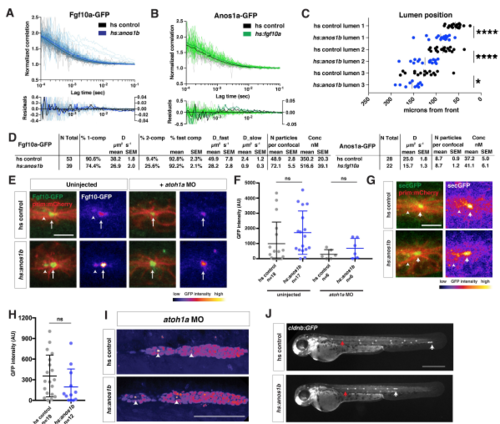
Characterization of the Fgf10a localization and diffusion in Anos1b over-expressing embryos, Related to Figure 7. (A) Top, autocorrelation curves for individual measurements (gray and light blue) and average two-component fit (black and blue) for genotypes indicated. Bottom, residuals for individual fits (gray and light blue) and average fit (black and blue). Left Y-axis is for individual fit residuals, and right Y-axis is for average fit residuals. (B) Top, autocorrelation curves for individual measurements (gray and light green) and average two-component fit (black and green) for genotypes indicated. Bottom, residuals for individual fits (gray and light green) and average fit (black and green). Left Y-axis is for individual fit residuals, and right Y-axis is for average fit residuals. (C) Position of microlumina in the primordium as scored by ZO-1 presence. X-axis represents distance from the front of the primordium. Vertical lines indicate the average. Each data point represents an individual embryo. * = p<0.05, **** = p < 0.0001. ANOVA p<0.0001. (D) Tables of fits. N total = total number of individual traces, % 1-comp = percentage of traces where the F test failed to reject a one-component fit, % 2-comp = percentage of traces where the F test rejected a one-component fit and did not reject a 2-component fit, % fast comp = % of molecules in the fast component, D = diffusion coefficient, N particles per confocal = number of molecules within the confocal volume, Conc = concentration of molecules within the confocal volume. Note, Anos1a-GFP was fitted to a 1-component model only. (E) Live imaging of microluminal Fgf10a-GFP (green) with membrane marker (red) and false coloring of Fgf10a-GFP signal only (fire look-up table, scale below) in uninjected embryos (left) and embryos injected with atoh1a morpholino (right). Arrows indicate Fgf10a-GFP signal in microlumina and arrowheads (left) indicate Fgf10a-GFP-producing central cells adjacent to the microlumen. Central cells are missing in embryos injected with atoh1a morpholino (right). Scale bar = 10 μm. (F) Total Fgf10a-GFP intensity in mature microlumina at the fourth apical constriction from the front in uninjected embryos (left) and embryos injected with atoh1a morpholino (right). Black lines are means and data points are individual embryos. n.s. = p > 0.05. (G) (Left) Secreted GFP from the fgf10a promoter (green) in microlumina of the primordium (red) in the indicated genotypes at 36 hpf. (Right) Secreted GFP from the fgf10a promoter only (intensity scale on lower right). Hotter colors represent higher intensity values. Arrows indicate secreted GFP in microlumina and arrowheads indicate GFP-producing central cells. Scale bar = 10 μm. (H) Quantification of total secreted GFP signal in mature microlumina as defined by the fourth apical constriction from the front of the primordium at 36 hpf for the indicated genotypes. Lines represent the mean, vertical lines the standard deviation and data points represent individual embryos. (I) Lumen integrity in embryos of genotypes indicated as assessed by accumulation of hsp70:sec-mCherry (arrows) in a primordium with nuclei marked by cxcr4b:H2AmCherry. Image is a maximum intensity projection of a Z-stack and is false colored based on fluorescence intensity using the fire look-up table (bottom). Sec-mCherry is distinguished from H2A-mCherry based on anatomical position, smaller size and higher signal intensity of microlumina compared to nuclei. Scale bar = 100 μm. (J) Live images of heat-shocked control embryo (right) and heat-shocked hsp70:anos1b embryo (left) transgenic for cldnb:lyn2GFP at 48 hpf. Red arrow indicates position of primordium at the start of 1-hour heat shock, and white arrow indicates position of the primordium at 48 hpf. Scale bar = 500 μm. |
Reprinted from Developmental Cell, 46(6), Wang, J., Yin, Y., Lau, S., Sankaran, J., Rothenberg, E., Wohland, T., Meier-Schellersheim, M., Knaut, H., Anosmin1 Shuttles Fgf to Facilitate Its Diffusion, Increase Its Local Concentration, and Induce Sensory Organs, 751-766.e12, Copyright (2018) with permission from Elsevier. Full text @ Dev. Cell