
Fig. 7
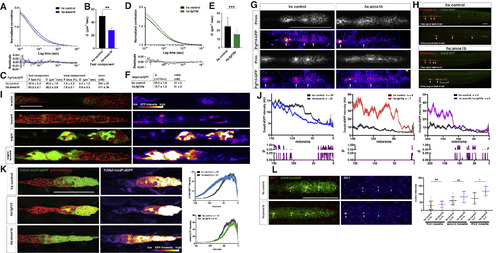
Anos1 Overexpression Blocks Fgf10a Accumulation and Signaling (A) Top, normalized autocorrelation curves (gray and light blue) and 2-component fits (black and blue) for Fgf10a-GFP in the indicated genotypes. Bottom, residuals of the fits. (B) Bar graph of the diffusion coefficient of the fast component in the genotypes indicated. Error bars represent SD. ∗∗ = p < 0.01. (C) Table of fitted values. F represents proportion of molecules in each component, and D is the diffusion coefficient. (D) Top, normalized autocorrelation curves (gray and light green) and 1-component fits (black and green) for Anos1a-GFP in the indicated genotypes. Bottom, residuals of the fits. (E) Bar graph of the diffusion coefficient in the genotypes indicated. Error bars represent SD. ∗∗∗ = p < 0.001. (F) Table of fitted diffusion coefficients (D). (G) Maximum intensity projection of the apical half of two heat-shocked control (left) and two heat-shocked hsp70:anos1b (right) live embryos transgenic for prim:lyn2mCherry and fgf10a:GFP-fgf10. Prim inset shows membrane outline of the primordium. Arrows in Fgf10a-GFP insets indicate patches of extracellular Fgf10a-GFP surrounding apical constrictions. These patches are present in 10 out of 10 heat-shocked control embryos but absent or strongly reduced in 5 out of 8 heat-shocked hsp70:anos1b embryos (top right) and slightly reduced in the remaining 3 out of 8 heat-shocked hsp70:anos1b embryos (bottom right). Warmer colors represent higher GFP fluorescence intensities. Scale bar represents 100 μm. (H) Maximum projections of z stacks of primordia in embryos of indicated genotype 1 hr and 10 hr after heat shock. Images are stills from Video S7. Scale bar represents 100 μm. (I) dusp6:d2EGFP expression (green) in the primordium (red) and dusp6:d2EGFP expression alone (fire heatmap) for the genotypes indicated. Scale bar represents 50 μm. Fire heatmap scale is shown below, with warmer colors indicating higher GFP fluorescence intensity. (J) Top, quantification of GFP intensity from dusp6:d2EGFP in the primordium along the anterior-posterior axis. x axis represents distance from the front of the primordium. Mean and SEM shown. n = number of embryos. Bottom, plot of p values comparing the two genotypes in the graph above for each position along the x axis. (K) Left, Wnt reporter readout at 36 hpf in the primordium of heat-shocked embryos of the indicated genotypes. Middle, Wnt reporter readout only. Scale bar represents 100 μm. Right, quantification of Wnt reporter intensity. X axis represents distance from the front of the primordium. Mean and SEM shown. n = number of embryos. (L) Left, immunostaining against ZO-1 and GFP in the primordium of 36-hpf embryos. Images are maximum projections. Middle, ZO-1 only (fire look-up table). Arrows indicate ZO-1 signal at the center of apical constrictions. Scale bar represents 100 μm. Right, quantification of microlumen volumes in forming neuromasts. Horizontal lines are the mean, vertical lines indicate the SD, and each data point is an individual embryo. n.s.= p > or = 0.05, ∗ = p < 0.05. ANOVA p < 0.0001. See also Figure S7 and Videos S6, S7, and S8. |
| Genes: | |
|---|---|
| Antibody: | |
| Fish: | |
| Condition: | |
| Anatomical Terms: | |
| Stage: | Prim-15 |
| Fish: | |
|---|---|
| Condition: | |
| Observed In: | |
| Stage: | Prim-15 |
Reprinted from Developmental Cell, 46(6), Wang, J., Yin, Y., Lau, S., Sankaran, J., Rothenberg, E., Wohland, T., Meier-Schellersheim, M., Knaut, H., Anosmin1 Shuttles Fgf to Facilitate Its Diffusion, Increase Its Local Concentration, and Induce Sensory Organs, 751-766.e12, Copyright (2018) with permission from Elsevier. Full text @ Dev. Cell