
Fig. 2
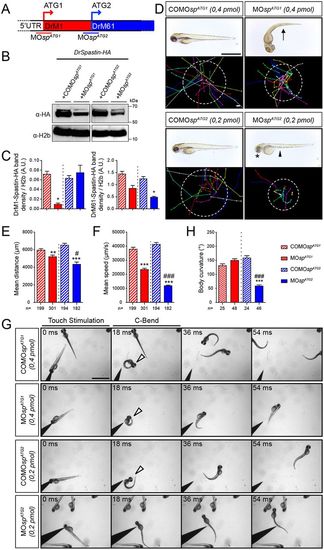
The knockdown of each spastin isoform differentially alters larval locomotion. (A) The knockdown of spastin main isoforms using a morpholino-based strategy. MOspATG1 and MOspATG2 morpholinos were designed to block spastin synthesis from the first (M1) or the second (M61) ATG. (B) Western blot analysis showing the efficiency of spastin isoform knockdown. Spastin expression was analysed in protein extracts from tailbud embryos injected with MOspATG1, MOspATG2 or their corresponding control morpholinos using an HA antibody. H2b was used as a loading control. (C) Quantification of DrM1 and DrM61 band density normalised to H2b values (A.U., arbitrary units), from four independent experiments. *P≤0.05. Non-parametric Mann–Whitney test. Error bars are s.e.m. (D) Overall morphology (upper panels) and locomotor behaviour (bottom panels) of 72 hpf larvae injected with MOspATG1 (n=301), MOspATG2 (n=182) or control morpholinos (COMOspATG1, n=199 and COMOspATG2, n=194). Upper panels: Arrow indicates the curved-tail phenotype of ATG1 morphants. Asterisk and arrowhead show smaller eyes and yolk tube agenesis in ATG2 morphants. Bottom panels: Tracking analysis of 72 hpf control and morphant larvae in a touch-escape response test. Each line represents the trajectory of one larva after touch stimulation, while the dotted circle radius symbolizes the mean swimming distance covered by all larvae. Scale bars: 2 mm. (E) Quantification of the mean swimming distance. (F) Quantification of the mean swimming speed. (G,H) Touch-evoked startle response of 72 hpf COMOspATG1 (n=25), COMOspATG2 (n=24), MOspATG1 (n=48) and MOspATG2 (n=46) larvae. (G) Representative time series of control and spastin morphant larvae responding to a tactile stimulation. White arrowheads indicate the characteristic high body curvature (called C-bend) occurring after the touch stimulation. ATG2 morphants are unable to make the C-bend movement. Scale bar: 2 mm. (H) Maximal C-bend body curvature angle of the startle responses. (E,F,H) **P≤0.01, ***P≤0.001 versus control larvae; #P≤0.05, ###P≤0.001 versus ATG1 morphants; Kruskal–Wallis ANOVA test with Dunn's post test. Error bars are s.e.m. |
| Fish: | |
|---|---|
| Knockdown Reagents: | |
| Observed In: | |
| Stage: | Protruding-mouth |