
Fig. 5
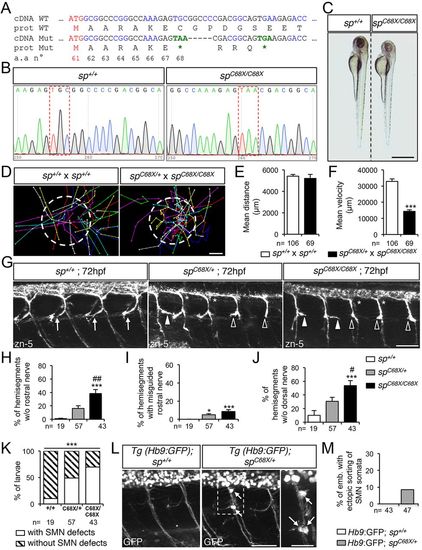
Spastin CRISPR/Cas9 mutants show overlapping locomotor and SMN phenotypes with ATG1 and ATG2 morphants. (A) mRNA and protein sequences of wild-type (WT) and spC68X CRISPR/Cas9 mutant (Mut). The second ATG codon (Met 61) and premature stop codons (*) are indicated in red and green, respectively. Black and blue letters are used to discriminate two successive codons. Numbers indicate amino acid position. (B) Sequence analysis of wild-type (sp+/+) and spC68X/C68X mutant DNA. Red dashed boxes show the nucleotide substitution generating a premature STOP codon. (C) Overall morphology of 72 hpf sp+/+ and spC68X/C68X larvae. Scale bar: 6 mm. Some mutant larvae are smaller than their control siblings. (D-F) Touch-evoked escape behaviour of 72 hpf larvae obtained from crosses between spC68X/C68X and spC68X/+ or control sp+/+. (D) Each line represents the trajectory of one larva after touch stimulation. Dotted-circle radius symbolises the mean swimming distance covered by all larvae. The distance between two dots represents the distance covered by a larva between two consecutive frames. Scale bar: 4 mm. (E,F) Quantification of the mean swimming distance (E) and mean swimming speed (F). (G) Immunolabelling of sMN in sp+/+, spC68X/+ and spC68X/C68X larvae using zn-5 antibody. Arrows indicate control rostral nerves, while white arrowheads, empty arrowheads and asterisks indicate misguided rostral nerve, missing rostral nerves and dorsal nerves of spC68X mutant larvae, respectively. (H-J) Quantification of sMN defects in 72 hpf sp+/+, spC68X/+ and spC68X/C68X larvae. Quantifications were carried out on 24 spinal hemisegments per larva. (K) Penetrance of SMN defects. (L) Immunolabelling of SMN in 72 hpf sp+/+ or spC68X/+ Tg(Hb9:GFP) larvae using a GFP antibody. Arrows indicate mispositioned SMN somata. (M) Percentage of larvae with ectopic sorting of SMN somata outside the spinal cord. (E,F,H-K,M) The number (n) of larvae analysed per condition is indicated under the corresponding histogram bar. *P≤0.05, ***P≤0.001 versus internal controls; #P≤0.05, ##P≤0.01 versus spC68X/+ larvae; non-parametric Mann–Whitney test (E,F); Kruskal–Wallis ANOVA test with Dunn's post test (H-J) and χ2 test (K). Error bars are s.e.m. (G,L) Lateral views of the trunk, anterior towards the left. Scale bars: 50 µm. |
| Fish: | |
|---|---|
| Observed In: | |
| Stage: | Protruding-mouth |