
FIGURE
Fig. 5
- ID
- ZDB-FIG-180920-25
- Publication
- Ledwon et al., 2018 - The expression of fgfr3 in the zebrafish head
- Other Figures
- All Figure Page
- Back to All Figure Page
Fig. 5
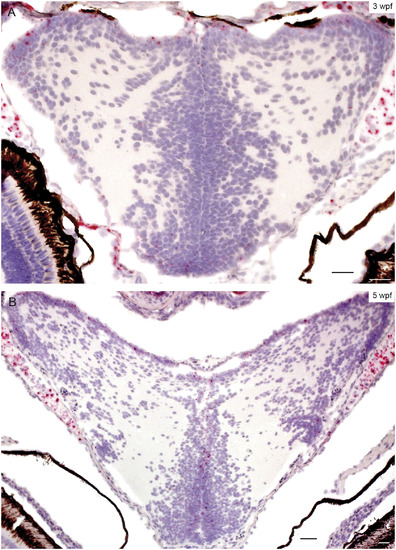
Expression pattern of fgfr3 in the juvenile zebrafish brain. Coronal sections at A) 3 wpf (SL 8 mm), B) 5 wpf (SL 12 mm) specimens, 20x magnification. Scale bar = 20 μm. |
Expression Data
| Gene: | |
|---|---|
| Fish: | |
| Anatomical Terms: | |
| Stage Range: | Days 21-29 to Days 30-44 |
Expression Detail
Antibody Labeling
Phenotype Data
Phenotype Detail
Acknowledgments
This image is the copyrighted work of the attributed author or publisher, and
ZFIN has permission only to display this image to its users.
Additional permissions should be obtained from the applicable author or publisher of the image.
Reprinted from Gene expression patterns : GEP, 29, Ledwon, J.K., Turin, S.Y., Gosain, A.K., Topczewska, J.M., The expression of fgfr3 in the zebrafish head, 32-38, Copyright (2018) with permission from Elsevier. Full text @ Gene Expr. Patterns