
Fig. 2
- ID
- ZDB-FIG-180920-22
- Publication
- Ledwon et al., 2018 - The expression of fgfr3 in the zebrafish head
- Other Figures
- All Figure Page
- Back to All Figure Page
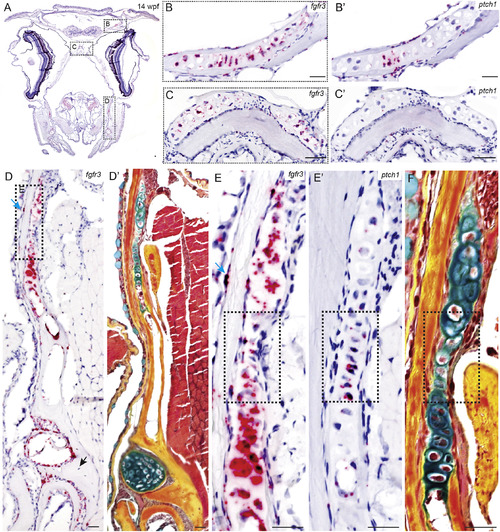
Comparative analysis of fgfr3 and ptch1 expression in the zebrafish head of young adult (14 wpf, SL 20 mm) specimen. A) General view of coronal section through head, fgfr3 probe is visualized in red, 5x magnification; B, B′) Pterosphenoid cartilage and C, C′) Posterior ethmoid plate stained for fgfr3 and ptch1, 64x magnification; D, D′) Palatoquadrate cartilage, fgfr3 and pentachrome stain, 20x magnification; E, E′, F) Digital magnification of presumed proliferative zone (dashed box), stain for fgfr3 (E), for ptch1 (E′) and pentachrome stain (F); blue arrow - osteoblasts residing in the periosteum; black arrow - osteocytes residing within the bone matrix; dashed boxes - digital magnification of presumed proliferative zone. Scale bar = 20 μm. |
| Genes: | |
|---|---|
| Fish: | |
| Anatomical Terms: | |
| Stage: | Adult |
Reprinted from Gene expression patterns : GEP, 29, Ledwon, J.K., Turin, S.Y., Gosain, A.K., Topczewska, J.M., The expression of fgfr3 in the zebrafish head, 32-38, Copyright (2018) with permission from Elsevier. Full text @ Gene Expr. Patterns