
FIGURE
Fig. 4
- ID
- ZDB-FIG-180920-24
- Publication
- Ledwon et al., 2018 - The expression of fgfr3 in the zebrafish head
- Other Figures
- All Figure Page
- Back to All Figure Page
Fig. 4
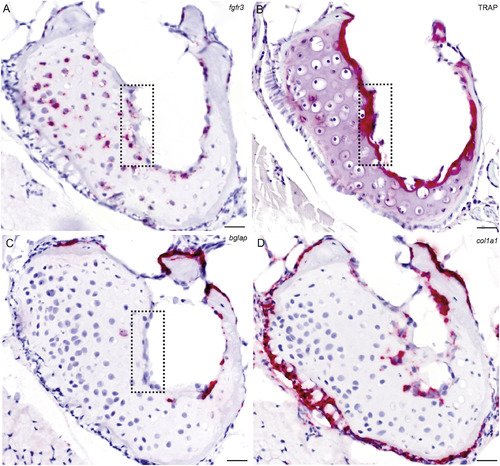
Comparative analysis of fgfr3, col1a1 and bglap expression with TRAP activity in the ceratohyal cartilage. Adjacent paraffin sections collected from adult at 14 wpf (SL 20 mm) specimen, 40x magnification. A) in situ stain for fgfr3; B) TRAP staining; C) in situ stain for bglap; D) in situ stain for col1a1. Dashed box indicates cells positive for fgfr3 and TRAP and negative for bglap. Scale bar = 20 μm. |
Expression Data
| Genes: | |
|---|---|
| Fish: | |
| Anatomical Terms: | |
| Stage: | Adult |
Expression Detail
Antibody Labeling
Phenotype Data
Phenotype Detail
Acknowledgments
This image is the copyrighted work of the attributed author or publisher, and
ZFIN has permission only to display this image to its users.
Additional permissions should be obtained from the applicable author or publisher of the image.
Reprinted from Gene expression patterns : GEP, 29, Ledwon, J.K., Turin, S.Y., Gosain, A.K., Topczewska, J.M., The expression of fgfr3 in the zebrafish head, 32-38, Copyright (2018) with permission from Elsevier. Full text @ Gene Expr. Patterns