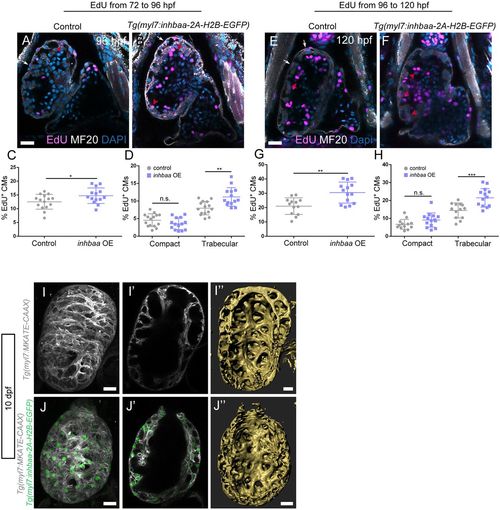
The TGFβ pathway ligand Inhbaa promotes trabecular cardiomyocyte proliferation. (A-H) Quantification and images of cardiomyocyte proliferation in the Tg(myl7:inhbaa-2A-H2B-EGFP) line after EdU incubation from 72 to 96 hpf (A-D) and from 96 to 120 hpf (E-H) in the two myocardial layers; myosin heavy chain staining labels cardiomyocytes. Overexpression of inhbaa drives cardiomyocyte proliferation in the trabecular, but not the compact, layer; each point represents a heart (D,H). (I-J″) Evaluation of the trabecular phenotype in the Tg(myl7:inhbaa-2A-H2B-EGFP) line at 10 dpf; Tg(myl7:MKATE-CAAX) expression labels cardiomyocyte membranes. A denser trabecular network is observed in inhbaa-overexpressing cardiomyocytes (compare cross-section in I′ with J′, and 3D surface rendering I″ with J″). Six control and seven inhbaa-overexpressing larvae are imaged. Data are mean±s.d., *P=0.041 in C, **P=0.0025 in D, **P=0.0011 in G, ***P=0.0007 in H; Student's two-tailed t-test; each experiment was repeated twice. Scale bars: 20 µm. Scale bars in A,E,I,J apply to B,F,I′,J′, respectively.
|
