
Fig. S2
- ID
- ZDB-FIG-180911-48
- Publication
- Oosterhof et al., 2018 - Colony-Stimulating Factor 1 Receptor (CSF1R) Regulates Microglia Density and Distribution, but Not Microglia Differentiation In Vivo
- Other Figures
- All Figure Page
- Back to All Figure Page
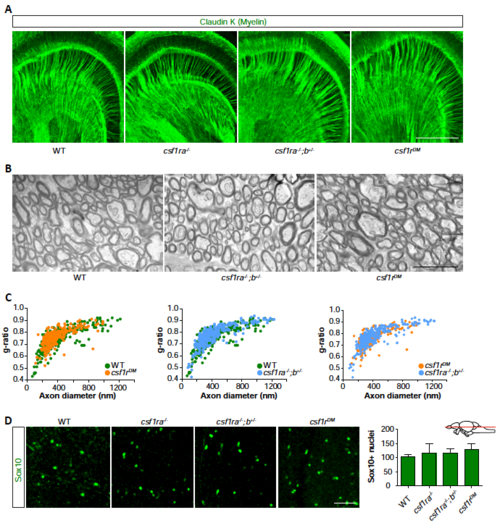
No signs of white matter pathology in csf1r mutant zebrafish. Related to Fig. 2. A Representative images of 5-month-old WT (n=3), csf1ra-/- (n=3), csf1ra-/-;b+/- (n=3) and csf1rDM (n=3) zebrafish brain sections stained with an antibody against ClaudinK (myelin). B Electron microscopy was performed on the dissected brains of WT (n=3), csf1ra-/-;b+/- (n=3) and csf1rDM (n=3) zebrafish (5 mpf). Representative images of myelin in WT, csf1ra-/-;b+/- and csf1rDM. C. Morphometric analysis of axons in brains of WT and csf1ra-/-;b+/- and csf1rDM mutant zebrafish, showing g-ratio (axon diameter/myelinated fiber diameter) at 5 months of age. Mean gratio’s presented as mean ± SEM were 0.74 +/- 0.01 for controls, 0.76+/- 0.01 for csf1ra-/-;b+/- and 0.77 +/- 0.0 for csf1rDM and did not differ between genotypes according to t-test (p = 0.22, 0.12 and 0.34 respectively). D Representative images of Sox10 (oligodendrocyte lineage cells) antibody labeling in deep brain regions of zebrafish. Adult zebrafish, aged 5 mpf, were used in A, B and C and aged 15 mpf in D. B Scale bars represent 200 μm (A), 1 μm (B), 40 μm (D). Each group in (C.) consisted of two to three zebrafish brains, and contained at least 240 myelinated fibers per genotype. |
| Fish: | |
|---|---|
| Observed In: | |
| Stage: | Adult |