
Fig. S5
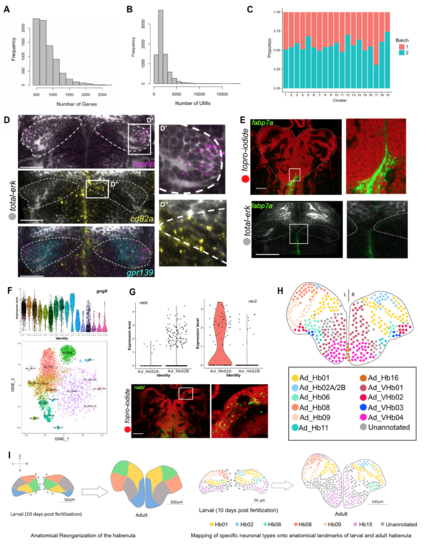
Quality Control of Adult Single Cell RNA-seq Dataset, Related to Figure 5 A. Distribution of genes detected across the filtered adult droplet dataset. B. Distribution of UMIs detected across the filtered adult droplet dataset. C. Composition of each cluster by experimental batch post batch correction and filtering. D. FISH for ventral cluster-specific genes cd82a and mprip that are also identified to be expressed in a regional manner in the larval ventral habenula. E. FISH labeling of fabp7a, marker for a progenitor-like cells in the adult and larval habenula. F. Violin plot showing expression of gng8 in larval and adult dataset. The expression values of gng8 (log(TPM+1) >2) were used to filter the adult dataset for RF analysis. The right panel shows a t-SNE plot of the resulting gng8 positive in the adult dataset. G. Violin plots showing examples of genes differentially expressed between Ad_Hb02A and Ad_Hb02B. Rac2 is enriched in Ad_Hb02A(right) and nebl is enriched in Ad_Hb02B(left) (upper panel). In situ hybridization showing right-enriched expression of nebl in the adult habenula. H. Schematic showing the validated neuronal types in the adult habenula in a single coronal slice. Schematic represents a projection across all slices assayed. Only information about left–right and dorso-ventral positioning of neuronal types is represented. I. Anatomical reorganization of the habenula between the time points analyzed in the study and the rough mapping of select neuronal types onto this map. As described by previous literature, the habenula undergoes complex morphogenetic changes in which the dorso-medial region migrates outwards laterally and the ventrolateral region migrates inwards medially. The positioning of the neuronal types found in our study corroborates this migratory pattern. |