
Fig. S2
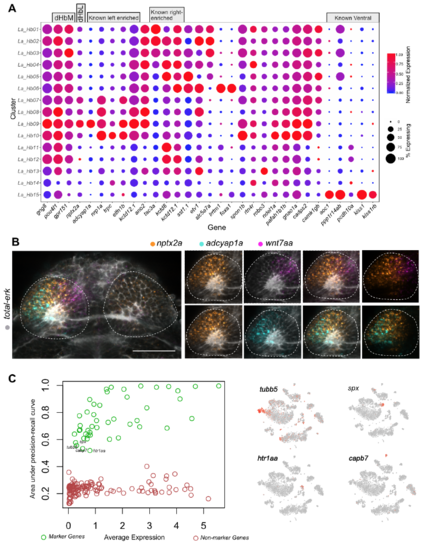
Mapping of Previously Characterized Regionalized Genes onto Droplet Clusters, Related to Figure 2. A. Expression patterns of previously described regionalized habenular genes. Genes that were previously described to be left-right asymmetric and specific to sub-regions (dHbM = dorso-medial habenula, dHbL = dorso-lateral habenula, vHb = ventral habenula) are highlighted with a grey box on top. B. In vivo expression pattern of nptx2a (dHbL marker) together with registered RNA-FISH signals of marker genes. The largest overlap of high nptx2a expressing cells is with the left enriched clusters, Hb08 (wnt7aa+) and Hb09 (adcyap1a+). Panels on the right show individual markers in the left habenula. Scale bar indicates 50 μm. C. Quantification of specificity of marker genes found by single cell analysis. Area under the precision recall curve (AUCPR) for marker genes (green) versus non-marker genes(red) within the same range of expression value [Right panel]. A few marker genes with low AUCPR values constitute those that are expressed in smaller clusters or that belong to the immature neuron cluster (Hb13) whose signatures are spread across multiple clusters in the dataset (see t-SNE plots in the right). |
| Gene: | |
|---|---|
| Fish: | |
| Anatomical Term: | |
| Stage: | Days 7-13 |