Fig. 7
- ID
- ZDB-FIG-180611-57
- Publication
- Triemer et al., 2018 - Superresolution imaging of individual replication forks reveals unexpected prodrug resistance mechanism
- Other Figures
- All Figure Page
- Back to All Figure Page
|
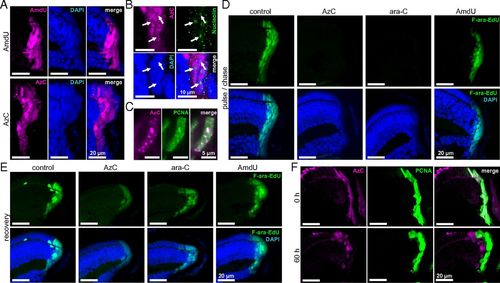
Metabolic incorporation of AzC and reversible inhibition of DNA synthesis in the retinal stem cell niche of zebrafish larvae. (A) Staining patterns of AzC and AmdU after 24-h treatment of 3-d-old fish with 10 mM AmdU or 5 mM AzC, fixation, and staining with SiR alkyne. (B) Lack of overlap between nucleolin immunofluorescent staining (arrows) and AzC after 24-h treatment of 3-d-old zebrafish with 5 mM AzC. (C) Overlap between AzC and PCNA staining after 24-h treatment of 3-d-old zebrafish with 5 mM AzC. (D) Inhibition of DNA synthesis by addition of AzC or ara-C. Three-day-old fish were incubated with 5 mM AzC, ara-C, or AmdU for 3 h, followed by coincubation with 1 mM F-ara-EdU for 21 h. F-ara-EdU was visualized using Alexa Fluor 488 azide. (E) Resumption of DNA synthesis after removal of AzC or ara-C. Following a 24-h pulse of 5 mM AzC, ara-C, or AmdU, the fish were moved into fresh water containing 1 mM F-ara-EdU for a 60-h recovery period before fixation and staining. (F) Movement of AzC-labeled DNA out of the retinal stem cell niche according to an AzC pulse, F-ara-EdU chase experiment as described in E. See SI Appendix, Figs. S29–S37 for the corresponding images of the liver, intestine, and brain. |

