
Fig. S1
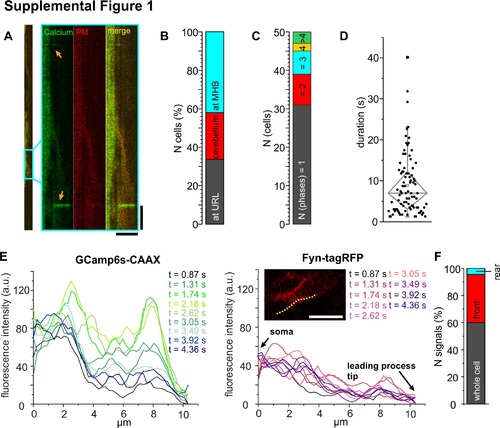
(A) Left: Full kymograph of the GCaMP6s-CAAX recording from the example THN shown in Fig 2J. Box indicates the region magnified on the right. Calcium transients are indicated by arrows. Vertical scale bar: 20 s, horizontal: 10 μm. (B) Signaling THNs were assigned to three regions in the cerebellum, but no regional preference for calcium transients was detected. (C) Low calcium frequencies detected with the PM-bound calcium sensor match results obtained from elavl3:H2B-GCaMP6s embryos. (D) Calcium transients show great variability in their duration. (E) Maximum signal intensity of GCamp6s from the example THN in (A) plotted by frame. Fyn-tagRFP-T fluorescence intensity remains similar over time, fluorescence increases in GCamp6s therefore are not due to position shifts. Intensities were measured along a line indicated in image. Intensity values were averaged over 5 neighboring points. (F) In about one third of all THNs, calcium transients occur at the front. CAAX, PM-targeting signal derived from K-Ras; GCaMP6, circular permutated green florescent protein-Calmodulin-M13 peptide 6; PM, plasma membrane; THN, tegmental hindbrain nuclei neuron. |