
Fig. 4
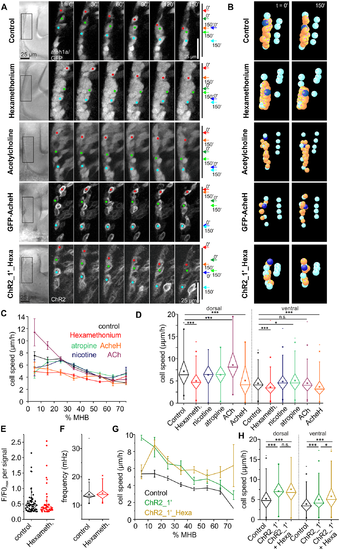
ACh promotes THN migration. (A) Tracking THNs in the atoh1a:KalTA/4xUAS-GFP fish line shows a migration decrease upon ACh receptor block, whereas stimulating THNs with excess ACh increases the migration speed in the dorsal portion of the MHB. Overexpressing AcheH mimics the effect of hexamethonium, whereas optogenetic depolarization rescues the hexamethonium speed decrease. THN progress over time is schematically indicated on the right. Elapsed time is indicated at the top. Scale bar: 25 μm. See also S7 Video. (B) Individual tracks (orange and dark blue) after shift correction (cyan) illustrate these effects. See also S8 Video. (C) Hexamethonium and AcheH overexpression slow cells down regardless of their starting point, whereas ACh has a stimulatory effect only in the dorsal region of the MHB. Neither atropine nor nicotine produce prominent effects. Means ± SEM are plotted per 10% MHB bin. (D) Dorsal (≤25% MHB) and ventral tracks (≥32.5% MHB) are similarly affected by hexamethonium or AcheH, whereas Atropine induces a slight speed increase only in ventral tracks. ACh increases speed in dorsally migrating THNs. Significance levels were calculated to control, and only significant differences are indicated. (E) Maximum values for each signal amplitude of F/F0 traces was plotted to illustrate that hexamethonium tends to dampen signal strength. Note that the difference to control is not statistically significant, due to the low N of signals. (F) The frequency spectrum contained in the FFT does not change upon hexamethonium treatment. (G) THN speed values along the MHB in ChR2-activating conditions are very similar regardless of hexamethonium treatment. Means ± SEM are plotted per 10% MHB bin. (H) Statistical analysis confirms that hexamethonium treatment does not change the ChR2 effect. Bars are means ± SEM. Data depicted in the graphs can be accessed in S1, S2 and S3 Data. ACh, acetylcholine; AcheH, Ache glycosylphosphatidylinositol-anchored isoform H; atoh1a; atonal 1a; ChR2, channelrhodopsin; FFT, fast Fourier transform; F/F0, fluorescence over background; GFP, green fluorescent protein; Hexameth, hexamethonium; MHB, midbrain-hindbrain boundary; n.s., not significant; THN, tegmental hindbrain nuclei neuron. |