
Fig. 1
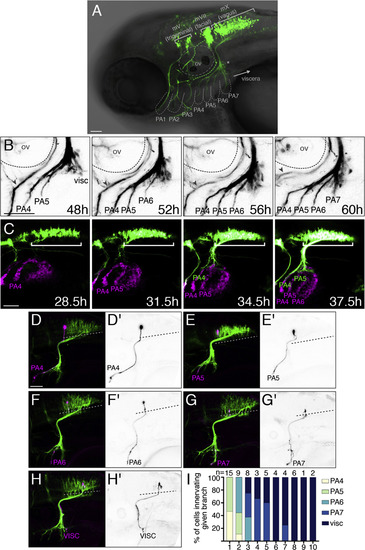
Topographic Mapping by Vagus Motor Neurons (A) Lateral view of a zebrafish embryo expressing Tg(isl1:Kaede) at 3 dpf. Brackets, cranial motor nuclei; ov, otic vesicle; PA, pharyngeal arches. Asterisk marks a subset of vagus sensory cells labeled by islet1. (B) mX axon branches innervate PAs sequentially. See Movie S1. Gray arrowhead indicates the glossopharyngeal motor nerve (mIX). (C) tcf21:mCherry+ PA muscle precursors (magenta) appear sequentially prior to mX axon entry. White bracket indicates mX nucleus expressing isl1:eGFPCAAX (green). See Movie S2. (D–H) mX neurons are arranged in a topographic map. Single neuron labeled by Tg(isl1:eGFPCAAX) in magenta or black (D′–H′) on Tg(isl1:mRFP) background (green). Dotted lines indicate the length of the mX territory. (D) Neuron in region 1 projecting to PA4; (E) neuron in region 2 projecting to PA5; (F) neuron in region 2 projecting to PA6; (G) neuron in region 3 projecting to PA7; (H) neuron in region 6 projecting to the visceral branch. (I) Quantification of (D)–(H). mX territory was divided into 10 equal-length bins along the A-P axis. In all figures, anterior is left and dorsal is up. The scale bars represent 50 μm. See also Figure S1. |
| Genes: | |
|---|---|
| Fish: | |
| Anatomical Terms: | |
| Stage Range: | Prim-5 to Protruding-mouth |