
FIGURE
Fig. S8
Fig. S8
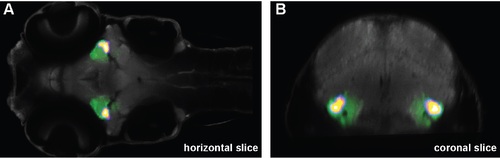
GFP expression in the TLa. Single horizontal (A) and coronal (B) z-stack images taken during confocal scanning of Tg(1.5kb-kctd15a-GFP) show GFP expression in the TLa. The heat maps in the single slices indicate the region missing in our kctd15 mutants. |
Expression Data
Expression Detail
Antibody Labeling
Phenotype Data
Phenotype Detail
Acknowledgments
This image is the copyrighted work of the attributed author or publisher, and
ZFIN has permission only to display this image to its users.
Additional permissions should be obtained from the applicable author or publisher of the image.
Full text @ PLoS One