
Fig. 7-S2
- ID
- ZDB-FIG-180418-41
- Publication
- Lee et al., 2017 - Genetic and neuronal regulation of sleep by neuropeptide VF
- Other Figures
- All Figure Page
- Back to All Figure Page
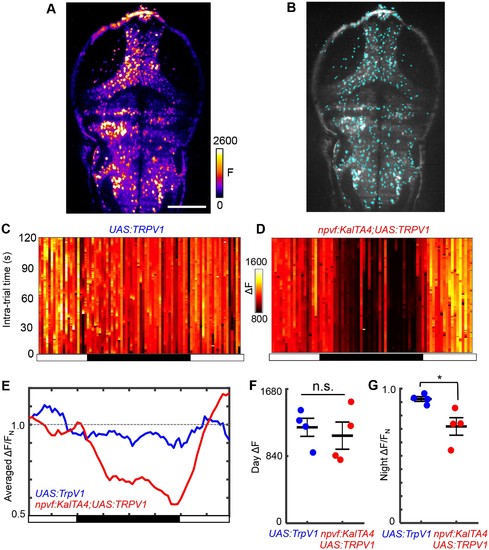
Chemogenetic stimulation of NPVF neurons decreases neuronal activity at night. (A) Representative image of fluorescence signal from an optical plane ~70 μm from the dorsal surface of a Tg(elavl3:H2B-GCaMP6s) brain at 6 dpf. Scale bar = 100 μm. (B) Automatic segmentation of active neurons, represented by cyan dots, using PCA/ICA. Typically 500–800 active neurons were extracted per animal. Some false positives were extracted from skin auto-fluorescence, contributing about 5% of the total segmented cells, which did not significantly affect subsequent analysis. (C,D) Neural activity (as reported by GCaMP6s fluorescence in Tg(elavl3:H2B-GCaMP6s) animals), averaged over all segmented active neurons, during the day/night cycle for representative Tg(UAS:TRPV1-TagRFP-T) and Tg(npvf:KalTA4); Tg(UAS:TRPV1-TagRFP-T) animals. Animals were treated with 2 μM Csn starting at 4 dpf, and imaging began at 6 dpf. Imaging consisted of 2 min sessions at 1 Hz every 15 min for 20–24 hr. ΔF = F – F0, where the baseline F0 is determined as described in the Materials and methods. (E) Normalized neural activity for representative Tg(UAS:TRPV1-TagRFP-T) and Tg(npvf:KalTA4); Tg(UAS:TRPV1-TagRFP-T) animals is lower at night, consistent with increased sleep. Each animal’s activity was normalized to FN = average activity during the 2 day periods of the same animal. (F) Neural activity during the day, averaged across the 2 day periods. Tg(UAS:TRPV1-TagRFP-T) and Tg(npvf:KalTA4); Tg(UAS:TRPV1-TagRFP-T) animals had the same level of neural activity (p=0.86, two-sample t-test). (G) Comparison of normalized neural activity at night. The night value for each animal is normalized to FN = averaged activity during the day of the same animal. Tg(npvf:KalTA4); Tg(UAS:TRPV1-TagRFP-T) and Tg(UAS:TRPV1-TagRFP-T) animals had decreased neural activity at night (25% and 7%, p=0.022 and p=0.023, respectively, one-sample t-test). The larger difference between day and night activity for Tg(npvf:KalTA4); Tg(UAS:TRPV1-TagRFP-T) compared with Tg(UAS:TRPV1-TagRFP-T) animals (p=0.028, two-sample t-test) is consistent with the increased sleep at night observed upon chemogenetic activation of NPVF neurons (Figure 5—figure supplement 2). Black and white bars in (C–E) indicate day and night. Data for 1 (C–E) or 4 (F,G) animals of each genotype are shown. |