Fig. s1
- ID
- ZDB-FIG-180417-15
- Publication
- Sylvester et al., 2017 - Population-scale organization of cerebellar granule neuron signaling during a visuomotor behavior
- Other Figures
- All Figure Page
- Back to All Figure Page
|
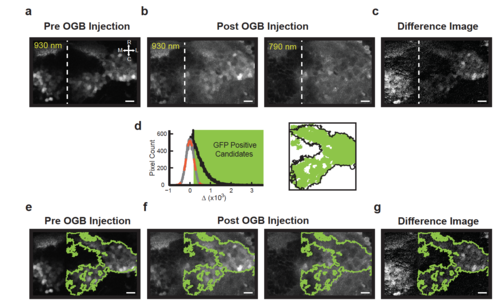
Spectral fingerprinting procedure for identifying the inner granule layer (IGL) after OGB dye loading. (a) Before OGB loading, GFP-positive granule cells in the inner granule layer (IGL) are easily identified with 930 nm excitation in Tg(gata1:GFP) zebrafish. The shown image plane contains large portions of the right cerebellar lobe and parts of the left lobe (dashed: midline); granule cell axons are located rostrally and medially. The scale bar, here and below, is 10 μm. (b) After OGB injection into the right lobe, the IGL has similar intensity to the rest of the cerebellum, both at 930 nm (left) and 790 nm (right) excitation. Note, however, the slightly elevated intensity in the IGL at 930 nm. (c) A pixel-by-pixel difference (Methods) of the 930 nm and 790 nm images highlights the IGL. (d; left) To identify the borders of the IGL, a histogram of pixel intensity differences (black) is compared to that expected from noise; the noise histogram is generated by mirroring negative difference values about zero (grey; gaussian fit shown in dashed orange). Those difference values a standard deviation or greater from zero were considered candidate GFP-positive pixels (green box). (right) Identified regions passing size and contiguity cutoffs (green, Methods) align closely with the outlines of the IGL identified in panel a (black). (e-g) Outlines of the region identified as containing GFP-positive granule neurons (green) overlaid onto the images in panels a-c. |

