
Fig. 5
- ID
- ZDB-FIG-180410-25
- Publication
- Sawamiphak et al., 2017 - Transient cardiomyocyte fusion regulates cardiac development in zebrafish
- Other Figures
- All Figure Page
- Back to All Figure Page
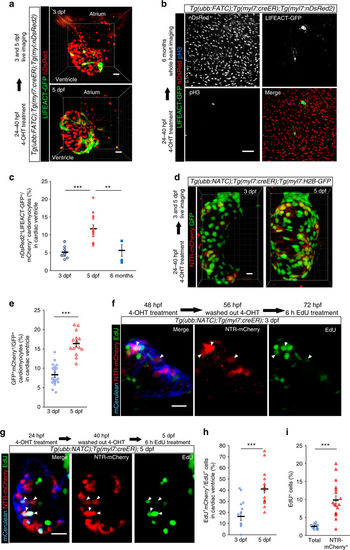
F/NATC-labeled cardiomyocytes are highly proliferative. a–c FATC-activated (LIFEACT-GFP+, green) cardiomyocytes (nDsRed+, red) in 3 and 5 dpf (a) and 6 mpf (b) Tg(ubb:FATC);Tg(myl7:creER);Tg(myl7:nDsRed2) fish treated with 4-OHT from 24 to 40 hpf were quantified as percentages of total ventricular cardiomyocytes (c). The same fish were analyzed at 3 and 5 dpf (a, c). d, e NTR-mCherry+ (red) cardiomyocytes (H2B-GFP+, green) of 3 and 5 dpf Tg(ubb:NATC);Tg(myl7:creER);Tg(myl7:H2B-GFP) fish treated with 4-OHT starting at 24 hpf (d) were quantified as percentage of total ventricular cardiomyocytes (e). f–h NTR-mCherry+ cardiomyocytes contribute substantially to the proliferating subset of cardiomyocytes. Tg(ubb:NATC);Tg(myl7:creER) embryos were treated with 4-OHT starting at 48 (f) or 24 (g) hpf to identify NATC-activated cardiomyocytes (mCerulean+,blue, and mCherry+, red). A 6 h EdU pulse (green) starting at 72 (f) or 120 (g) hpf labeled cells undergoing DNA synthesis. Arrowheads point to mCerulean+mCherry+EdU+ cardiomyocytes, which were quantified as percentages of total EdU+ ventricular cardiomyocytes (h). i Percentages of proliferating cardiomyocytes, assessed by a 6 h pulse of EdU, relative to total cardiomyocytes and relative to the NTR-mCherry+ cardiomyocyte population in 5 dpf Tg(myl7:nuDsRed2) and Tg(myl7:creER);Tg(ubb:NATC) ventricles, respectively. Three-dimensional volume renderings (a, d) and maximum or average intensity projections (b, f, g) of 90 (a, b), 84 (d), and 10–14 (f, g) μm thick confocal stacks are shown. In c, e, h and i, bars and error bars represent means ± S.E.M. Each circle (n = 12 in c, 20 in e, 10 in h, and 9 in i), triangle (n = 12 in c, 20 in e, 19 in h, and 19 in i), and square (n = 3) represents a cardiac ventricle. **p ≤ 0.01, ***p ≤ 0.001 (two-tailed student’s t-test). Representative images from a total of 12 (a), 3 (b), 18 (d), 11 (f), and 19 (g) animals are shown. Scale bars: 20 μm (a, d, f, g), 50 μm (b) |