
Fig. 4
- ID
- ZDB-FIG-180406-10
- Publication
- Barros-Becker et al., 2017 - Live imaging reveals distinct modes of neutrophil and macrophage migration within interstitial tissues
- Other Figures
- All Figure Page
- Back to All Figure Page
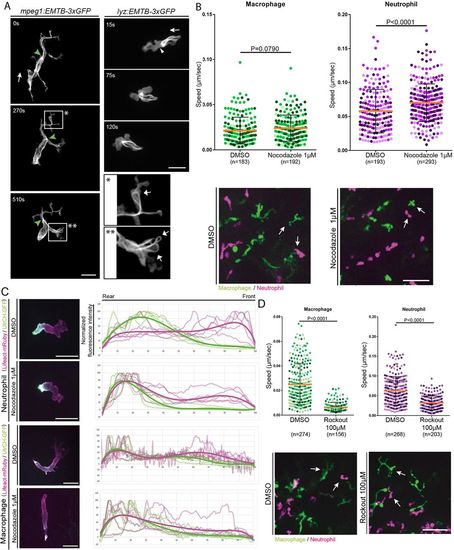
Microtubule and ROCK inhibition affects both neutrophil and macrophage migration in vivo. (A) EMTB-3xGFP transiently expressed in neutrophils showed microtubules localized at the back of the cell. Very few microtubules were localized at the front (white arrowhead). Macrophages expressing EMTB-3xGFP showed microtubules extending to the back of the cell and into protrusions at the leading edge. Scale bar: 20 µm. Macrophages transiently expressing EMTB-3xGFP showed microtubule loops in some protrusions (magnified views indicated by * and **; white arrows). See Movie 5. Green arrowhead, MTOC. White arrows in main panels indicate direction of migration. Images are representative of three independent experiments. (B) Microtubule inhibition using nocodazole 1 µM increased the velocity of neutrophils but not random macrophage motility. The mean±s.d. velocity is shown; P-values were calculated with a least squares means. Representative images below show that both cell types had morphology changes upon treatment with nocodazole (white arrows). See Movie 6. Scale bar: 50 µm. (C) UrtCH–GFP and Lifeact–mRuby localization in the presence and absence of nocodazole. Nocodazole induced hyperpolarization of UtrCH–GPF in neutrophils, but not macrophages. Actin intensity was quantified and normalized as a percentage of the total. The relative expression of UtrCH–GPF and Lifeact–mRuby is presented in a graph for the front-to-rear axis (bold line indicates trend line of each set of color values). Five cells from three independent experiments were quantified. Scale bars: 20 µm. (D) ROCK inhibition by treatment with 100 µM Rockout blocked macrophage migration, but had only a partial effect on neutrophil migration. Mean±s.d. speed is shown; P-values were calculated with a least squares means analysis. Representative images below the graph show the cell morphology changes for each condition. Scale bar: 50 µm. See Movie 8. |