
Fig. 5
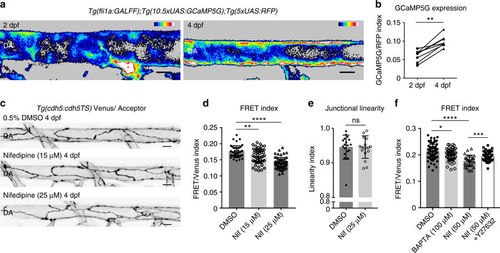
Calcium signaling maintains lower VE-cadherin tension during artery maturation. a Heatmap image showing average intensity projection of fli1a-driven GCaMP5G expression (indicating calcium) in the DA at 2 dpf (left) and 4 dpf (right). Colors range from black ( = low calcium) to white ( = high calcium). Scale bar = 10 μm. b Increase in fluorescence intensity index ( = fli1a driven GCaMP5G/ fli1a-driven RFP) in the dorsal wall of the DA of n = 9 embryos imaged at 2 and 4 dpf. **p = 0.0012, from paired t test. c Junctional morphology of ECs in the DA (Venus, grey) of a 0.5% DMSO, a 15 μM/0.5% DMSO Nifedipine and a 25 μM/0.5% DMSO Nifedipine treated embryo at 4 dpf. Treatment from 2 to 4 dpf. Scale bar = 10 μm. d Ratio-metric FRET values in junctions of 0.5% DMSO (n = 42 junctional ROIs from n = 5 embryos), 15 μM Nifedipine (n = 54 junctional ROIs from n = 6 embryos) and 25 μM Nifedipine (n = 59 junctional ROIs from n = 6 embryos) treated embryos. Treatment was from 2 to 4 dpf. Error bars represent mean ± s.d.; DMSO – 15 μM Nifedipine **p = 0.0068, DMSO – 25 μM Nifedipine ****p < 0.0001, from unpaired two-sided Mann–Whitney test.e Junctional linearity index in 0.5% DMSO treated controls (n = 5) versus 25 μM Nifedipine-treated embryos (n = 6). Each data point represents a junction, n = 18 control junctions measured and n = 18 junctions from Nifedipine-treated embryos. Error bars represent mean ± s.d.; not significant (ns) p = 0.8147, from unpaired two-sided Mann–Whitney test. f Ratio-metric FRET values quantified from 1% DMSO-treated controls (n = 39 junctional ROIs from n = 6 embryos), BAPTA-AM-treated (100 μM for 1 h, n = 58 junctional ROIs from n = 8 embryos), Nifedipine-treated (50 μM for 30 min, n = 27 junctional ROIs from n = 5 embryos) and Nifedipine + Y-27632-treated embryos (n = 47 junctional ROIs from n = 8 embryos). Error bars represent mean ± s.d.; 1% DMSO – 100 μM BAPTA-AM *p = 0.0498; 1% DMSO – 50 μM Nifedipine ****p < 0.0001; 50 μM Nifedipine - 50 μM Nifedipine + 50 μM Y-27632 ***p = 0.0008, from unpaired two-sided t test |