
Fig. 2
- ID
- ZDB-FIG-180403-19
- Publication
- Roh-Johnson et al., 2017 - Macrophage-Dependent Cytoplasmic Transfer during Melanoma Invasion In Vivo
- Other Figures
- All Figure Page
- Back to All Figure Page
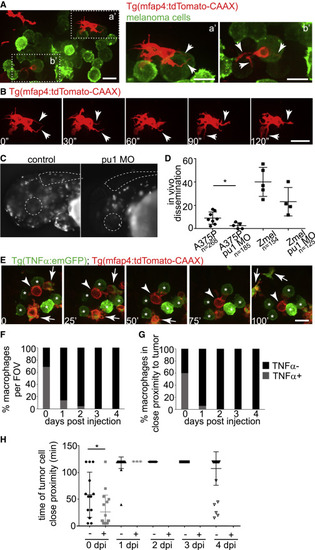
Macrophages in the Tumor Microenvironment Are Dynamic and in Close Proximity with Melanoma Cells In Vivo, and Are Predominantly TNF-α-Deficient Macrophages (A) Zebrafish macrophages labeled with Tg(mfap4:tdTomato-CAAX)xt6 (red) interact with human melanoma cells expressing LifeAct-eGFP (green). Two boxes outlined in left panel are magnified in the right boxes (a′, b′). Macrophage protrusions are in close proximity with tumor cells (arrows). (B) Still images from time-lapse video of macrophage in (a′), 30 s time interval, revealing dynamic protrusions (arrows). See also Figure S2; Movies S2, S3, and S4. (C) Images of macrophages labeled with Tg(mfap4:tdTomato-CAAX)xt6 in control and pu.1/spi1b MO-injected larvae. Larval eye and hindbrain are demarcated with dotted lines. See also Figure S3. (D) Percent dissemination of human melanoma cells (A375P) and zebrafish melanoma cells (Zmel) with and without pu.1/spi1b MO (30 pg). Each data point is an independent experiment, and n indicates number of total larvae. Error bars are mean ± SD. One-way ANOVA (p < 0.001), followed by unpaired non-parametric t test (p = 0.02). Asterisk indicates p < 0.05. (E) Still images of a time lapse of 0 day post tumor cell transplantation larvae. Macrophages express Tg(mfap4:tdTomato-CAAX)xt6 (red). Pro-inflammatory macrophages also express Tg(TNFα:emGFP)fh508. Melanoma cells (green only) are labeled with asterisks. Arrowhead marks a TNF-α– macrophage, and arrows mark TNF-α+ macrophages. See also Figure S4; Movie S5. (F) Quantification of TNF-α+ (gray) versus TNF-α– (black) macrophages in the tumor cell field of view 0–4 days post tumor cell injection (dpi). n = 5, 15, 11, 10, and 11 larvae for dpi 0–4, respectively. (G) Quantification of TNF-α+ (gray) versus TNF-α– (black) macrophages in close proximity with melanoma cells 0–4 dpi. n = 5, 15, 11, 10, and 11 larvae for dpi 0–4, respectively. (H) Quantification of time of macrophage/tumor cell contact in minutes (of a 120 min time lapse) for TNF-α+ versus TNF-α– macrophages (labeled “+” and “–” on the graph, respectively) on each day post injection. For 0 dpi, TNF-α+ (n = 18), TNF-α– (n = 13); 1 dpi, TNF-α+ (n = 3), TNF-α– (n = 56); 2 dpi, TNF-α– (n = 18); 3 dpi, TNF-α– (n = 17); 4 dpi, TNF-α– (n = 39). Time-lapse recordings were 120 min each. Error bars are mean ± SD. Asterisks indicate p < 0.05. Scale bar, 30 μM in all panels. Statistically significant difference between TNF-α– versus TNF-α+ tumor cell contact on 0 dpi, one-way ANOVA (p < 0.001), followed by unpaired non-parametric t test (p = 0.02). |
| Genes: | |
|---|---|
| Fish: | |
| Condition: | |
| Anatomical Terms: | |
| Stage Range: | Long-pec to Day 4 |
Reprinted from Developmental Cell, 43, Roh-Johnson, M., Shah, A.N., Stonick, J.A., Poudel, K.R., Kargl, J., Yang, G.H., di Martino, J., Hernandez, R.E., Gast, C.E., Zarour, L.R., Antoku, S., Houghton, A.M., Bravo-Cordero, J.J., Wong, M.H., Condeelis, J., Moens, C.B., Macrophage-Dependent Cytoplasmic Transfer during Melanoma Invasion In Vivo, 549-562.e6, Copyright (2017) with permission from Elsevier. Full text @ Dev. Cell