
Fig. s5
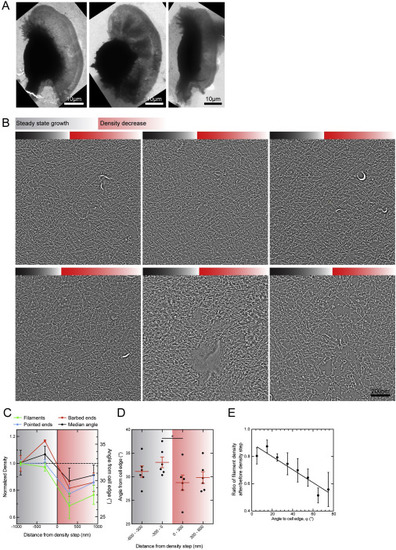
Changes in Filament Parameters at a Decrease in Filament Density, Related to Figure 5 (A and B) Network structure analysis of seven lamellipodia tomograms in three correlated cells revealed consistent features at the point, where the actin density decreased due to the manipulation by the micropipette. Overview electron micrographs and 5.5nm tomogram slices are shown for all regions. (C) Averages of filament density, barbed and pointed ends and median angle from the cell edge showed the consistent changes at the density step. (D) Median angles of all analyzed regions are plotted for 300nm space bins before and after the decrease in actin filament density (right). (Paired t test, p = 0.0249). (E) Normalized ratio of filaments after density step to filaments before density step is plotted against the filament angle from the cell edge together with a linear regression curve. (Pearson constant, r = −0.936) Mean and s.e.m. are shown on all graphs. |
Reprinted from Cell, 171, Mueller, J., Szep, G., Nemethova, M., de Vries, I., Lieber, A.D., Winkler, C., Kruse, K., Small, J.V., Schmeiser, C., Keren, K., Hauschild, R., Sixt, M., Load Adaptation of Lamellipodial Actin Networks, 188-200.e16, Copyright (2017) with permission from Elsevier. Full text @ Cell