
Fig. s1
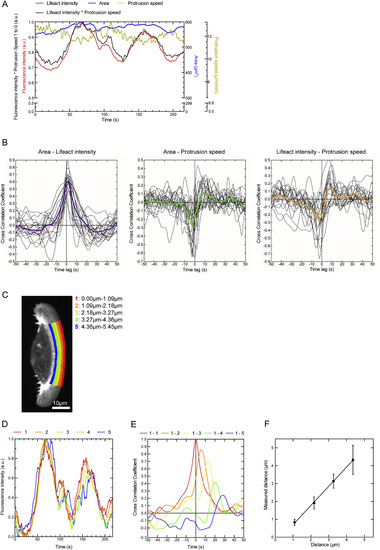
Details of Quantification of Live Cell Imaging Parameters, Related to Figure 1 (A) Temporal fluctuations of lifeact:GFP signal, projected cell area and protrusion speed of the cell shown in Figure 1 are shown normalized from the maximum value to zero. The lifeact:GFP signal multiplied by the instantaneous speed is shown normalized from the maximum to zero as well. (B) Temporal crosscorrelation functions of Area – lifeact:GFP intensity, Area-protrusion speed and lifeact:GFP intensity – Protrusion speed for 21 individual cells are shown in black. Averaged cross-correlation functions from a spline fit to the combined single-cell cross-correlation functions are shown in purple (Area – lifeact:GFP intensity), green (Area – Protrusion speed) and yellow (lifeact:GFP intensity – Protrusion speed). (C) Confocal images of a migrating keratocyte expressing lifeact:GFP were analyzed using consecutive 1.09μm wide regions spanning the lamellipodium. (D) Resulting lifeact:GFP intensity maps are plotted against time. (E) Temporal cross correlation functions of region ‘1’ at the very front of the cell to consecutive regions are plotted as a function of time lag. (F) Time lag between peaks of the curves shown in H multiplied by cell velocity and resulting distances are plotted against distance between analyzed regions. Measured mean and s.d. of twelve cells are shown together with a linear regression (Pearson constant = 0.9997, p = 0.0003). |
Reprinted from Cell, 171, Mueller, J., Szep, G., Nemethova, M., de Vries, I., Lieber, A.D., Winkler, C., Kruse, K., Small, J.V., Schmeiser, C., Keren, K., Hauschild, R., Sixt, M., Load Adaptation of Lamellipodial Actin Networks, 188-200.e16, Copyright (2017) with permission from Elsevier. Full text @ Cell