
Fig. 5
- ID
- ZDB-FIG-180202-39
- Publication
- Singh et al., 2017 - Different developmental histories of beta-cells generate functional and proliferative heterogeneity during islet growth
- Other Figures
- All Figure Page
- Back to All Figure Page
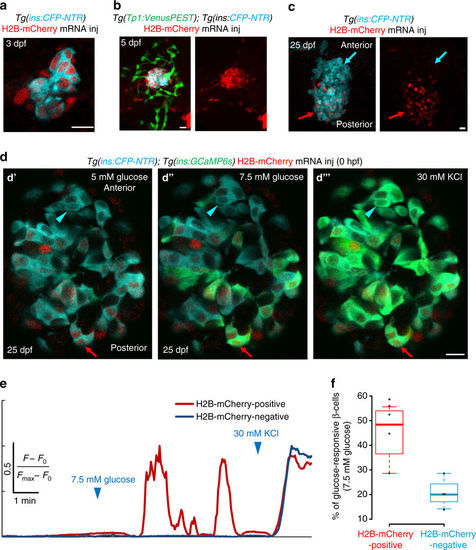
The embryonic beta-cells are highly glucose-responsive compared to beta-cells differentiating from post-embryonic progenitors. a Primary islets from Tg(ins:CFP-NTR); Tg(GCaMP6s) animals injected with H2B-mCherry mRNA at the one-cell stage and traced until 3 dpf. Beta-cells (blue) show uniform expression of H2B-mCherry (red) (single confocal plane). b Primary islets from Tg(ins:CFP-NTR); Tg(Tp1:VenusPEST) animals injected with H2B-mCherry mRNA at the one-cell stage and traced until 5 dpf. Beta-cells (blue) show strong expression of H2B-mCherry (red), whereas the post-embryonic progenitors (green) are H2B-mCherry-negative (confocal projection). c Primary islets from Tg(ins:CFP-NTR); Tg(GCaMP6s) animals injected with H2B-mCherry mRNA at the one-cell stage and traced until 25 dpf. The H2B-mCherry-negative beta-cells localize preferentially within the anterior regions of the islet (blue arrow), whereas the H2B-mCherry-positive cells occupy the posterior (red arrow) (confocal projection). d Ex vivo live imaging of islets from Tg(ins:GCaMP6s); Tg(ins:CFP-NTR) animals at 25 dpf injected with H2B-mCherry mRNA at the one-cell stage. Beta-cells (blue) were stimulated with 5 (basal) d′ and 7.5 mM d-glucose d′′ followed by depolarization via addition of 30 mM KCl d′′′ while monitoring GCAMP6s-fluorescence (green). A red arrow indicates an H2B-mCherry-positive beta-cell, whereas the blue arrowhead indicates an H2B-mCherry-negative beta-cell. e Normalized GCaMP6s fluorescence intensity trace. The H2B-mCherry-positive cell (red trace, red arrow in c) exhibits oscillating GCaMP6s-fluorescence in response to glucose, while the H2B-mCherry-negative cell (blue trace, blue arrowhead in c) only responds to depolarization with KCl. f Tukey style boxplot showing that a higher proportion of the H2B-mCherry-positive beta-cells respond to glucose, as compared to the H2B-mCherry-negative beta-cells. A cell was considered as H2B-mCherry-negative if the mean fluorescence intensity was similar to background (n = 46 H2B-mCherry-positive and 44 H2B-mCherry-negative cells from four islets) (unpaired two-tailed t-test, *p < 0.05). Scale bars, 10 µm |