
FIGURE
Fig. 3
- ID
- ZDB-FIG-180119-26
- Publication
- Bancelin et al., 2017 - Probing microtubules polarity in mitotic spindles in situ using Interferometric Second Harmonic Generation Microscopy
- Other Figures
- All Figure Page
- Back to All Figure Page
Fig. 3
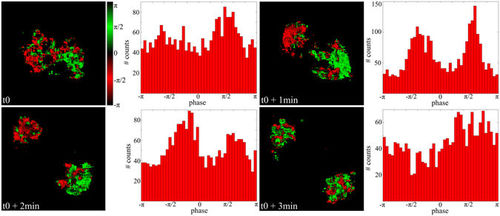
Image and histogram of the phase of the SHG signal generated in the spindles during mitosis. Field of view: 29 × 29 µm2. |
Expression Data
Expression Detail
Antibody Labeling
Phenotype Data
Phenotype Detail
Acknowledgments
This image is the copyrighted work of the attributed author or publisher, and
ZFIN has permission only to display this image to its users.
Additional permissions should be obtained from the applicable author or publisher of the image.
Full text @ Sci. Rep.