
Image
|
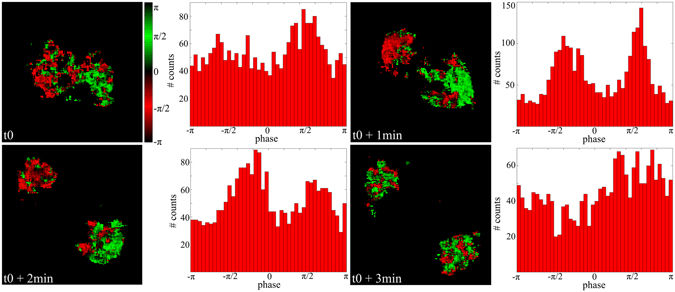
Figure Caption
Fig. 3
Image and histogram of the phase of the SHG signal generated in the spindles during mitosis. Field of view: 29 × 29 µm2.
Acknowledgments
This image is the copyrighted work of the attributed author or publisher, and
ZFIN has permission only to display this image to its users.
Additional permissions should be obtained from the applicable author or publisher of the image.
Full text @ Sci. Rep.