
FIGURE
Fig. 4
- ID
- ZDB-FIG-171031-7
- Publication
- Vågberg et al., 2015 - X-ray phase-contrast tomography for high-spatial-resolution zebrafish muscle imaging
- Other Figures
- All Figure Page
- Back to All Figure Page
Fig. 4
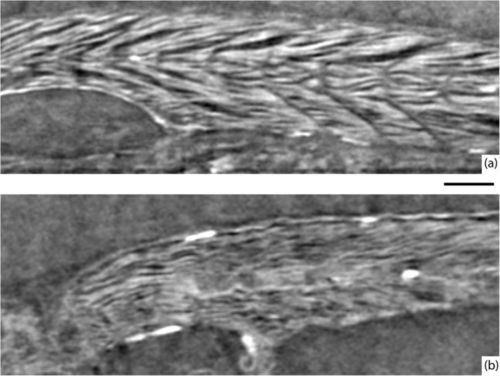
Comparison of healthy and sapje zebrafish. (a) Muscle structure in a 20 dpf healthy zebrafish. (b) Muscle structure in a 20 dpf sapje zebrafish. The slices are from the same anatomical location in both fish. The scale bar is 100 μm and applies to both images. |
Expression Data
Expression Detail
Antibody Labeling
Phenotype Data
| Fish: | |
|---|---|
| Observed In: | |
| Stage: | Days 14-20 |
Phenotype Detail
Acknowledgments
This image is the copyrighted work of the attributed author or publisher, and
ZFIN has permission only to display this image to its users.
Additional permissions should be obtained from the applicable author or publisher of the image.
Full text @ Sci. Rep.