
- Title
-
X-ray phase-contrast tomography for high-spatial-resolution zebrafish muscle imaging
- Authors
- Vågberg, W., Larsson, D.H., Li, M., Arner, A., Hertz, H.M.
- Source
- Full text @ Sci. Rep.
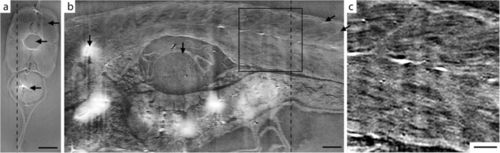
Phase-contrast tomography of 20 dpf healthy zebrafish. (a) Axial slice, corresponding to the dashed line through (b). Arrows indicate (from top) muscle tissue, notochord, and stomach. Scale bar is 100 μm. (b) Sagittal slice, corresponding to the dashed line through (a). The myofibril pattern is clearly visible. The arrows (from left) indicate bone, swim bladder and two myosepta. The scale bar is 100 μm. (c) Enlargement of the boxed area in (b). Scale bar is 50 μm. |
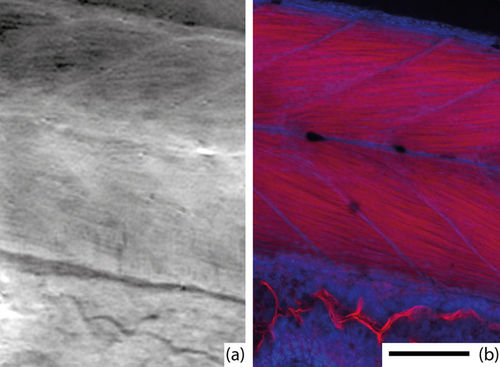
Comparison with histology. (a) A slice from X-ray phase-contrast tomography and (b) epifluorescent confocal microscopy. The images show the approximately same part of the fish. Muscle myofibrils and myosepta are clearly visible in both images. In the X-ray image, brighter corresponds to stronger phase shift, which is approximately proportional to density, whereas the confocal microscopy shows the red-stained myofibrils and blue-stained nuclei. The scale bar is 100 μm and applies to both images. |
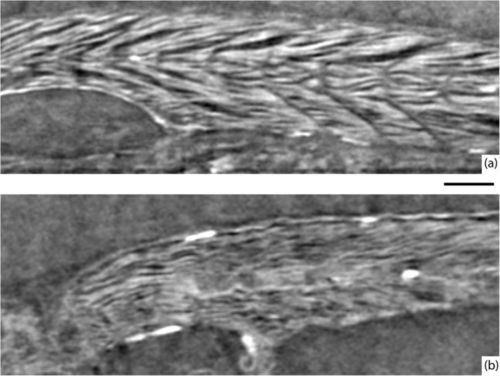
Comparison of healthy and sapje zebrafish. (a) Muscle structure in a 20 dpf healthy zebrafish. (b) Muscle structure in a 20 dpf sapje zebrafish. The slices are from the same anatomical location in both fish. The scale bar is 100 μm and applies to both images. PHENOTYPE:
|