
Fig. 5
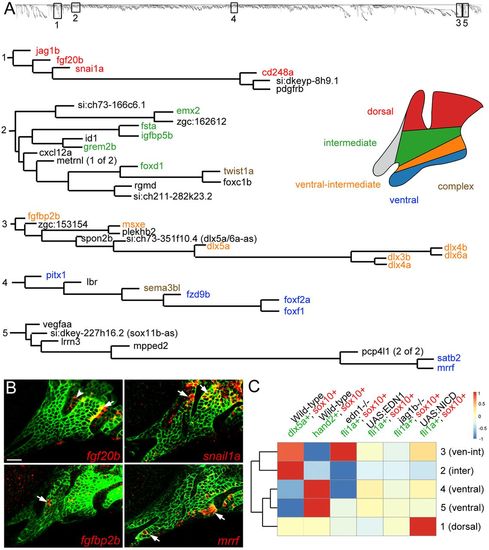
Co-variance network analysis reveals cohorts of similarly regulated arch genes. (A) Five representative clusters (1-5) were chosen from the dendrogram (top) generated by co-variance analysis. Gene names are color-coded based on expression patterns that are published or verified in this study. ‘Complex’ refers to genes with broader expression in multiple domains. (B) Four genes discovered by co-variance analysis were confirmed by in situ hybridization (red) of sox10:GFPCAAX embryos at 36 hpf; anti-GFP staining (green) marks CNCCs of the mandibular and hyoid arches. Arrows indicate CNCC expression and the arrowhead indicates fgf20b expression in the first pharyngeal pouch. Scale bar: 20 μm. (C) TOM driver array analysis (see Materials and Methods) shows experiments that drove clustering (red) or disrupted clustering (blue). The dendrogram on the left shows the relatedness of clusters based on which datasets drove their clustering. |
| Genes: | |
|---|---|
| Fish: | |
| Anatomical Terms: | |
| Stage: | Prim-25 |