
Fig. 5
- ID
- ZDB-FIG-170914-22
- Publication
- West et al., 2017 - An Actomyosin-Arf-GEF Negative Feedback Loop for Tissue Elongation under Stress
- Other Figures
- All Figure Page
- Back to All Figure Page
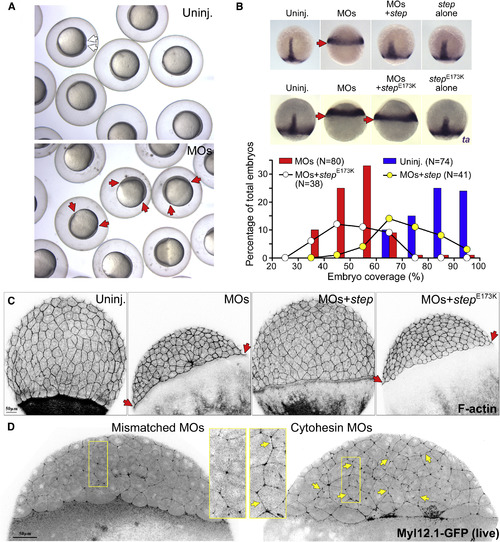
Cytohesins Downregulate Myosin and Promote Tissue Elongation for Zebrafish Epiboly (A) Differential interference contrast (DIC) imaging of embryos injected with a cytohesin morpholino cocktail (MOs) are delayed in epiboly (red arrows) compared with uninjected embryos that reach ∼90% epiboly (white arrows) in the same time. Figure S4A shows the expression pattern of the four targeted cytohesin genes. (B) In situ hybridization of the leading-edge marker ta reveals ∼90% epiboly of uninjected embryos, a delay with the morpholino cocktail (red arrows), a partial rescue with step mRNA co-injection, and failed rescue with stepE173K mRNA co-injection (red arrow). Injection of step mRNA or stepE173K mRNA alone had no effect. The embryos are oriented with the animal pole at top. Quantifications of embryo populations are below. (C) Embryos with normal or delayed epiboly were stained for F-actin (phalloidin) and imaged by confocal microscopy. Delayed epiboly correlated with smaller apical areas of ectodermal (EVL) cells. (D) Embryos expressing non-muscle myosin light-chain 12-GFP (myl12.1-GFP) were injected with mismatched or cytohesin morpholinos and imaged live prior to 50% epiboly. The images are Imaris Surpass View maximum-intensity projections. Note the myosin enrichment at tri-cellular junctions in each case, but that the cytohesin morpholino cocktail elicited increased myosin localization to cable-like structures (yellow arrows) connecting the tri-cellular junctions. In each of two experiments, the cytohesin morpholino cocktail resulted in enhanced myosin cables (for n = 8 and 5 embryos in each experiment) not observed with the mismatched morpholinos (for n = 4 embryos in each experiment) or without injection (for n = 2 and 6 embryos in each experiment). Figure S4B shows further mismatched morpholino analysis. |
| Genes: | |
|---|---|
| Fish: | |
| Knockdown Reagents: | |
| Anatomical Terms: | |
| Stage Range: | 30%-epiboly to 90%-epiboly |
| Fish: | |
|---|---|
| Knockdown Reagents: | |
| Observed In: | |
| Stage Range: | 30%-epiboly to 90%-epiboly |