
Fig. 7
- ID
- ZDB-FIG-170824-46
- Publication
- Zhang et al., 2016 - Stereotyped initiation of retinal waves by bipolar cells via presynaptic NMDA autoreceptors
- Other Figures
- All Figure Page
- Back to All Figure Page
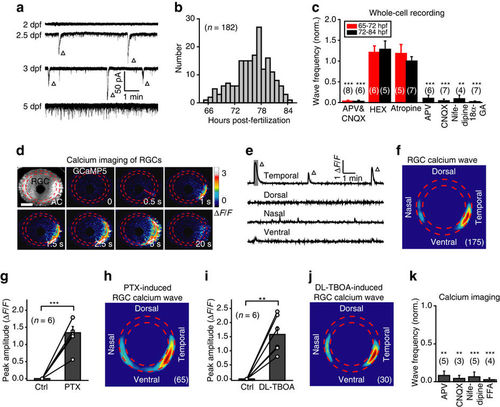
RGCs exhibit spontaneous retinal waves. (a) Spontaneous electrical activities of RGCs monitored with in vivo whole-cell recordings in 2- to 5-d.p.f. larvae. The triangles mark spontaneous wave-like GDPs. (b) Temporal distribution of the occurrence of spontaneous GDPs in RGCs (182 cells from 99 larvae). (c) Pharmacological properties of spontaneous GDPs in RGCs recorded during 65–72 h.p.f. (red) or 72–84 h.p.f. (black). The number in the brackets represents the number of RGCs recorded. APV&CNQX, 100 μM and 50 μM; HEX, 100 μM; atropine, 2 μM; APV, 100 μM; CNQX, 50 μM; nifedipine, 50 μM; 18α-GA, 50 μM. (d) Pseudocolor time-lapse two-photon images showing a spontaneous calcium wave of retinal ganglion cells (RGCs) in a 3 d.p.f. Tg(HuC:GCaMP5) larva. Left top, fluorescence image showing GCaMP5 expression in most of RGCs and some of amacrine cells (ACs). Red arrow, initiation site of the wave. Scale bar, 100 μm. (e) Calcium activities at four retinal regions. The shadowed area marks the period of images shown in d. (f) Superposition of the initiation site of 175 RGC calcium waves from 9 larvae. (g,i) Summary of the data showing the effect of picrotoxin (PTX, 200 μM) (f) or DL-TBOA (50 μM) (h) on RGC calcium waves. (h,j) Superposition of the initiation site of 65 RGC calcium waves induced by bath application of PTX (g) or 30 RGC waves by DL-TBOA (i). (k) Summary of the data showing the effects of APV (100 μM), CNQX (50 μM), nifedipine (50 μM) and FFA (50 μM) on the frequency of RGC calcium waves. The number in the brackets represents the number of retinae imaged. **P<0.01, ***P<0.001; two-tailed paired Student’s t-test for the data in (c,g,i,k). Data are represented as mean±s.e.m. |