
FIGURE
Fig. S6
- ID
- ZDB-FIG-170607-27
- Publication
- Benedetti et al., 2016 - INaP selective inhibition reverts precocious inter- and motorneurons hyperexcitability in the Sod1-G93R zebrafish ALS model
- Other Figures
- All Figure Page
- Back to All Figure Page
Fig. S6
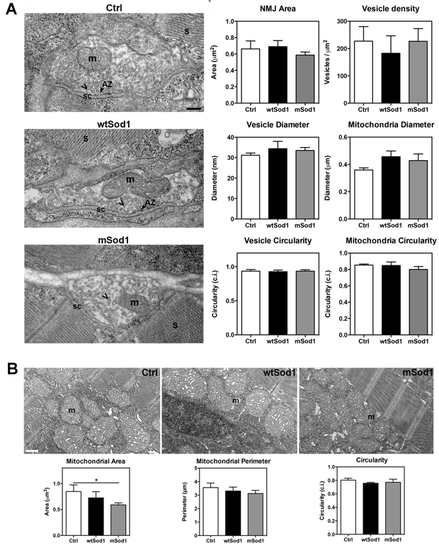
The ultrastructure of mSod1 neuromuscular junctions (NMJs) is preserved at 96 hpf. (A) Electron micrographs showing the neuromuscular junction ultrastructure of 96 hpf control (Ctrl), wtSod1 and mSod1 larvae. The pre-synaptic boutons contained many vesicles (chevron) widely distributed in the pre-synaptic terminals without any particular polarisation, some which are fusing in the active zone (AZ). The pre-synaptic terminals also included mitochondria (m); they are separated from the muscle fibres by a well-defined synaptic cleft (sc). The junctions did not show any clear post-synaptic specialisations. Well-organized sarcomeres (S) were visible in muscle fibres. Scale bar: 200 nm. The morphometric analyses did not reveal any differences in neuromuscular junction area (Ctrl: 0.66 ± 0.10 µm2; wtSod1: 0.69 ± 0.07 µm2; mSod1: 0.59 ± 0.04 µm2), or synaptic vesicle density (Ctrl: 227.10 ± 53.33 n/µm2; wtSod1: 182.50 ± 64.10 n/µm2; mSod1: 226.70 ± 46.38 n/µm2), diameter (Ctrl: 31.20 ± 1.07 nm; wtSod1: 34.42 ± 3.60 nm; mSod1: 33.55 ± 1.44 nm), circularity (Ctrl: 0.94 ± 0.02 circularity index [c.i]; wtSod1: 0.92 ± 0.02 c.i.; mSod1: 0.93 ± 0.02 c.i.), area (Ctrl: 588.80 ± 36.45 nm2; wtSod1: 695.10 ± 128.90 nm2; mSod1: 677.40 ± 52.55 nm2; not shown) or perimeter (87.08 ± 3.32 nm in Ctrl, 94.83 ± 10.28 nm in wtSod1, 93.46 ± 4.31 nm in mSod1; not shown) or in mitochondria number (Ctrl: 0.95 ± 0.15; wtSod1: 0.90 ± 0.20; mSod1: 0.80 ± 0.10), diameter (Ctrl: 0.36 ± 0.02 µm; wtSod1: 0.46 ± 0.04 µm; mSod1: 0.43 ± 0.05 µm), circularity (Ctrl: 0.85 ± 0.01 c.i.; wtSod1: 0.85 ± 0.04 c.i.; mSod1: 0.80 ± 0.04 c.i.), area (Ctrl: 0.08 ± 0.01 µm2; wtSod1: 0.12 ± 0.03 µm2; mSod1: 0.08 ± 0.01 µm2; not shown) or perimeter (Ctrl: 1.07 ± 0.06 µm; wtSod1: 1.28 ± 0.14 µm; mSod1: 1.11 ± 0.05 µm; not shown) in the pre-synaptic terminals. The columns represent the mean values ± SEM of the indicated parameter in 30 neuromuscular junctions of three fish of each genotype. The measures were statistically analysed using the Kruskal-Wallis test, corrected by means of Dunn’s multiple comparison procedure. (B) Electron microscopy images showing muscle mitochondria (m) morphology in Ctrl, wtSod1 and mSod1 larvae. Scale bar: 500 nm. Muscle mitochondria area was significantly smaller in the mSod1 larvae (Ctrl: 0.89 ± 0.09 μm2; wtSod1: 0.82 ± 0.12 μm2; mSod1: 0.54 ± 0.04 μm2), but there was no significant difference in mitochondria perimeter (Ctrl: 3.66 ± 0.23 μm; wtSod1: 3.44 ± 0.25 μm; mSod1: 2.93 ± 0.19 μm) or circularity (Ctrl: 0.81 ± 0.02 c.i.; wtSod1: 0.79 ± 0.03 c.i.; mSod1: 0.79 ± 0.03 c.i). The measurements refer to one hundred mitochondria in six Ctrl, four wtSod1 and six mSod1 larvae, and were statistically analysed using one-way ANOVA, corrected by means of Tukey’s multiple comparison tests (*P<0.05). |
Expression Data
Expression Detail
Antibody Labeling
Phenotype Data
Phenotype Detail
Acknowledgments
This image is the copyrighted work of the attributed author or publisher, and
ZFIN has permission only to display this image to its users.
Additional permissions should be obtained from the applicable author or publisher of the image.
Full text @ Sci. Rep.