
Fig. 1
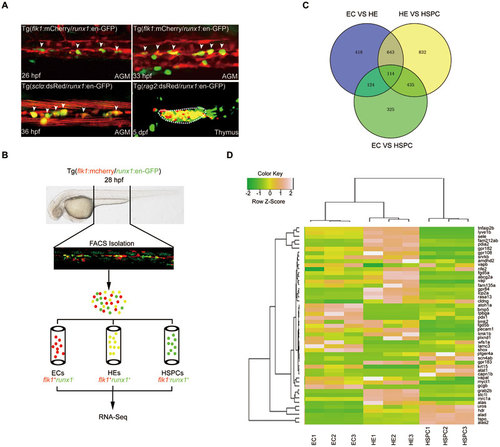
RNA-deep sequencing analysis of gene expression in ECs, HE and HSPCs from Tg(flk1:mCherry/runx1:en-GFP) transgenic embryos. (A) Fluorescence signals in AGM and thymus of the indicated transgeneic lines showing that Tg(runx1:en-GFP) is able to label HE and HSPCs. White arrowheads denote HE or emerging HSPCs in AGM. (B) Flowchart of sorting and RNA-Seq analysis of the indicated cells from 28 hpf Tg(flk1:mCherry/runx1:en-GFP) embryos. (C) RNA-Seq analysis results showing the numbers of differentially expressed genes in sorted ECs, HECs and HSPCs from 28 hpf Tg(flk1:mCherry/runx1:en-GFP) embryos. (D) Heat-map analysis of selected genes based on RNA-Seq data. |
| Genes: | |
|---|---|
| Fish: | |
| Anatomical Terms: | |
| Stage Range: | Prim-5 to Day 5 |