
FIGURE
Fig. 3
- ID
- ZDB-FIG-170308-28
- Publication
- Huckenpahler et al., 2016 - Imaging the adult zebrafish cone mosaic using optical coherence tomography
- Other Figures
- All Figure Page
- Back to All Figure Page
Fig. 3
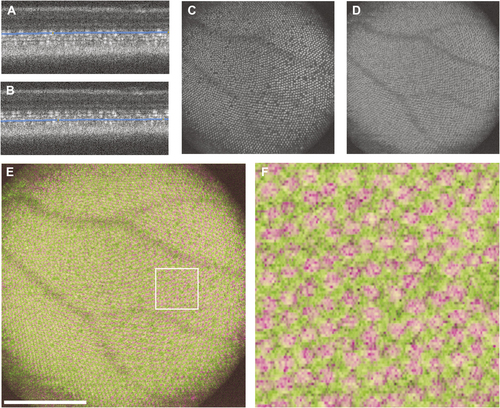
Visualization of the UV and red/green photoreceptor layers. (A) B scan with contour placed at the UV layer and (B) the same B scan with the contour moved to the red/green layer. The resultant images generated produce en face images of (C) the UV cone layer and (D) the red/green cone layer. A false-colored overlay (E) of these two layers showing the alternating/interleaved geometry of these photoreceptor sublamina. Scale bar = 200 µm. (F) A cropped region shows the interleaved red/green and UV cone mosaics. |
Expression Data
Expression Detail
Antibody Labeling
Phenotype Data
Phenotype Detail
Acknowledgments
This image is the copyrighted work of the attributed author or publisher, and
ZFIN has permission only to display this image to its users.
Additional permissions should be obtained from the applicable author or publisher of the image.
Full text @ Vis. Neurosci.