
Fig. 2
- ID
- ZDB-FIG-170308-27
- Publication
- Huckenpahler et al., 2016 - Imaging the adult zebrafish cone mosaic using optical coherence tomography
- Other Figures
- All Figure Page
- Back to All Figure Page
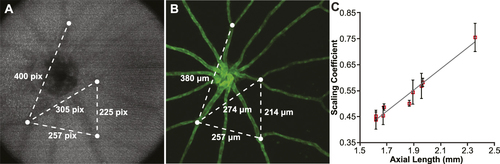
Deriving the lateral scale of in vivo OCT images of the fli1:eGFP zebrafish retina. (A) En face image generated by positioning the custom contour within the retinal nerve fiber layer. Measurements (in pixels) were taken between multiple blood vessel branch points (white dots). (B) Corresponding ex vivo fluorescent microscopy image of the same retina, with measurements (in µm) taken between the same blood vessel branch points in (A). The OCT:microscopy measurements were averaged for each eye and used to determine the size of the OCT scan in µm. A scaling coefficient for each scan was calculated as the ratio between the actual size of the OCT scan to the nominal OCT scan size (in this case, 1200 µm). (C) The scaling coefficient for each scan was plotted against the axial length for that eye and fit with a linear model. Error bars represent one standard deviation for each eye. |