
Fig. S1
- ID
- ZDB-FIG-170303-19
- Publication
- Kuri et al., 2017 - A high-sensitivity, bi-directional reporter to monitor NF-κB activity in cell culture and zebrafish in real-time
- Other Figures
- All Figure Page
- Back to All Figure Page
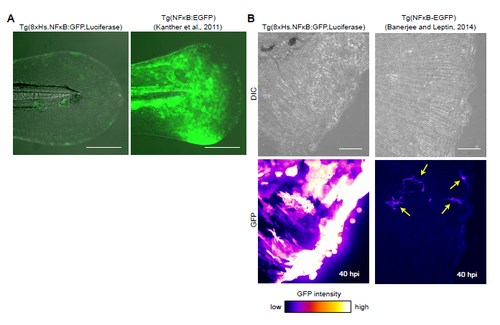
Comparison between Tg(8xHs.NFκB:GFP,Luciferase) and two other previously developed zebrafish NF-κB-responsive transgenic lines. (A) Tg(NFκB:EGFP) embryos display stronger GFP signal in the skin compared to the Tg(8xHs.NFκB:GFP,Luciferase) embryos at 3dpf. Note the Tg(NFκB:EGFP) line was originally described in Kanther et al., 2011. (B) Comparison between Tg(8xHs.NFκB:GFP,Luciferase) and Tg(NFκB-EGFP) after tailfin cut. The GFP was examined 40 hours post-injury (hpi). Note equal laser intensity was used to illustrate that Tg(NFκB-EGFP) embryos display weaker GFP signal in the injured site compared to the Tg(8xHs.NFκB:GFP,Luciferase) embryos. Yellow arrows indicate cells with GFP expression. Note Tg(NFκB-EGFP) line was originally described in Banerjee and Leptin, 2014. Anterior is to the left. Scale bars: 200μm (A) and 30μm (B). |