
Fig. 5
- ID
- ZDB-FIG-170223-34
- Publication
- Dyballa et al., 2017 - Distribution of neurosensory progenitor pools during inner ear morphogenesis unveiled by cell lineage reconstruction
- Other Figures
- All Figure Page
- Back to All Figure Page
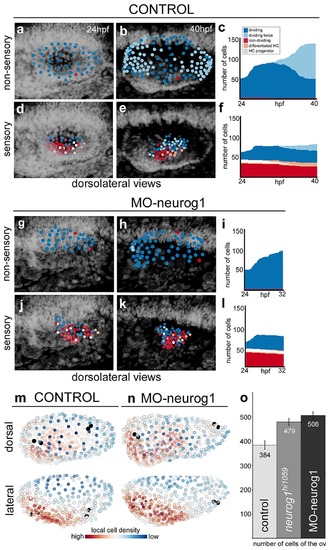
Heterogeneous cell behavior in the non-sensory and sensory domains. Neighboring cells in the non-sensory and sensory domains of control (a–f) and MO-neurog1 (g–l) were tracked and reconstructed cell centers were color-coded according to cell proliferation/differentiation status (see legend in (c); Video 9); they were plotted on the top of the corresponding raw images (a–b,d–e,g–h,j–k; nuclei in grey level), or in graphs over time (c,f,i,l) displaying the total number of cells in each domain and their status in the course of the video. Note the differences in the graphs between non-sensory and sensory domains, but not between control and MO-neurog1 embryos. (m–n) Estimated local cell densities at 24 hpf are represented by color-coded cell centers across the whole otic epithelium (Video 10). Tg[Brn3c:GFP] embryos injected with H2B-mCherry and with/without MO-neurog1 at 1cell-stage were used for full lineage reconstruction (Tables 1–2). Anterior is always to the left. ID Datasets: 140507aX for control, 140519aX for MO-neurog1; see Figure 5—figure supplement 1 for additional analyses. (o) Graphic depicting the total number of cells in the otic vesicles for wild type (control, n = 3), neurog1hi1059/ hi1059 mutant in the Tg[Isl3:GFP] background (n = 3), and MO-neurog1 embryos (n = 2) at 24 hpf. |