
Fig. S4
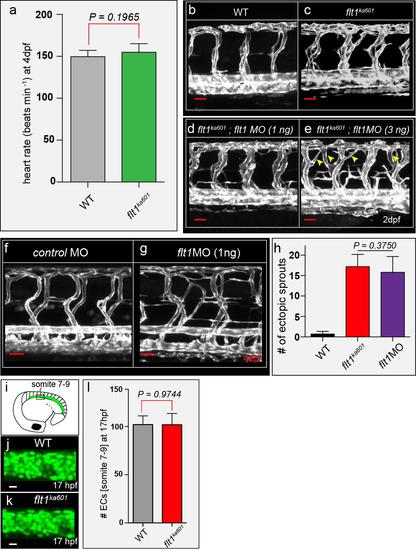
Flt1 targeting morpholinos and quantification of endothelial cell numbers (a) Heart rates in 4dpf WT and flt1ka601, mean ± s.e.m, n=10. (b-e) flt1ka601 with 1ng (d) and 3ng (e) flt1 targeting MO injected. Note: the 3ng dosage causes arterial branching defects (arrowheads) not observed in flt1ka601 mutants. (f,g) Vascular pattern in Tg(kdrl:EGFP) embryos injected with control MO (f), and 1ng flt1 ATG targeting MO (g). (h) Quantification of f,g; mean ± s.e.m, n=10. Note hyper-branching equal to flt1ka601. (i-k) Imaging of endothelial nuclei in 17hpf WT and flt1ka601 embryos. EC numbers were counted between somite 7-9 (i). (l) Quantification of j,k shows no difference in EC numbers. ECs were counted using ImageJ plugin 3D object counter, mean ± s.e.m, n=4. MO, morpholino. Scale bar, 50μm in b-g; 10μm in j,k. |