
Fig. 3
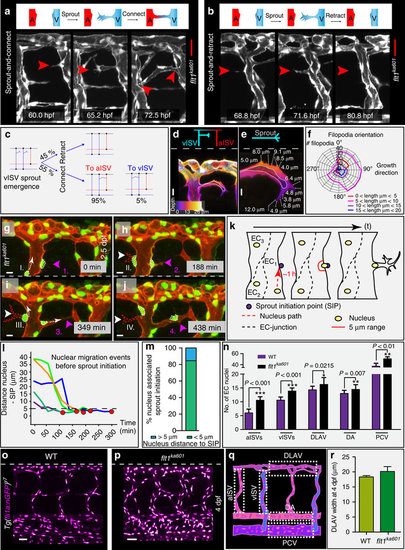
Imaging and quantification of sprouting kinetics in flt1ka601 mutants. (a) Time lapse imaging of sprout initiation and anastomosis formation in flt1ka601 mutant. Sprout initiation (60.0 hpf), elongation (65.2 hpf) and connection-anastomoses (72.5 hpf) with adjacent aISV. (b) Time lapse imaging of sprout initiation and retraction in flt1ka601 mutant. Endothelial cells produce filopodia (68.8 hpf), extend a sprout (71.6 hpf), which subsequently retracts (80.8 hpf). (c) Quantification of data in (a,b) showing % of sprouts retracting (top part, 45%) or connecting (bottom part, 55%) to adjacent ISVs. In the latter scenario sprouts in 95% of cases connected to aISV (red) and in 5% of cases to vISV (blue). Angiogenic behaviour was analysed in time-lapse confocal movies, n=20 embryos. (d–f) Filopodia directionality and length in flt1ka601 mutants (n=10 embryos, n=920 filopodia). (g–j) Time lapse imaging of endothelial nuclei in Tg(fli1a:nGFP)y7; Tg(kdrl:hsa.HRAS-mcherry)s916 showing association between nuclear position and sprouting initiation point (SIP). Note that sprouts arise in close proximity to the position of the nucleus. Arrowheads indicate sprouts; nuclei at indicated time points (sprout initiation with actively migrating nucleus towards SIP I, II, III, IV and nucleus already located at SIP 1,2,3,4). (k) Schematic representation of nuclear position with respect to SIP. (l,m) Quantification of observations in g–j. Red dot indicates sprout initiation time point. Note that sprouting preferentially occurs when endothelial nuclei are within less than 5 μm from SIP (SIP below dotted line in (l)). n=5 (l) and n=13 (m). (n–q) Quantification of EC nuclei in aISV, vISVs, DLAV, DA and PCV of WT and flt1ka601 embryos at 4 dpf; mean±s.e.m., t-test, n=21 embryos per genotype. (r) Quantification of DLAV width in WT and flt1ka601 mutant, n=9 embryos per genotype. A, artery; aISV, arterial intersegmental vessel; DA, dorsal aorta; DLAV, dorsal longitudinal anastomotic vessel; EC, endothelial cell; PCV, posterior cardinal vein; SIP, sprout initiation point; V, vein; vISV, venous intersegmental vessel. Scale bar, 30 μm in a,b; 10 μm in d,e,g–j; 50 μm in o,p. |
| Genes: | |
|---|---|
| Fish: | |
| Anatomical Terms: | |
| Stage Range: | Pec-fin to Day 4 |
| Fish: | |
|---|---|
| Observed In: | |
| Stage Range: | Pec-fin to Day 4 |