
Fig. 3
- ID
- ZDB-FIG-170220-19
- Publication
- Linsley et al., 2017 - Congenital myopathy results from misregulation of a muscle Ca2+ channel by mutant Stac3
- Other Figures
- All Figure Page
- Back to All Figure Page
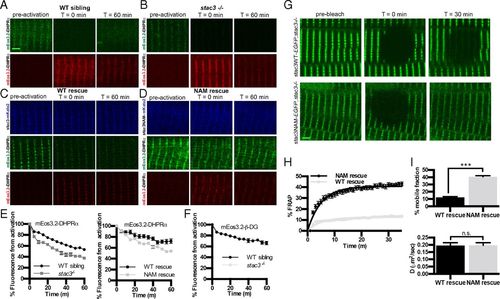
DHPRα is less stable in stac3 mutants. (A and B) Time course for optical pulse-labeling assay of mEos3.2-DHPRα1S expressed in the myofibers of WT sibling (A) and stac3−/− (B). Green channel (Top) and red channel (Bottom) before photoconversion (Left), immediately following photoconversion (Middle), and 60 min after photoconversion (Right). (C and D) Time course for optical pulse-labeling assay of mEos3.2-DHPRα1S in stac3−/− muscles expressing stac3WT-mKate2 (C) or stac3NAM-mKate2 (D). Blue channel representing the far-red mKate2 fluorescence (Top), green channel (Middle), and red channel (Bottom) for mEos3.2-DHPRα1S fluorescence as in A and B. (E) Time course of decay of photoconverted mEos3.2-DHPRα1S shows that fluorescence decays faster in stac3−/− (n = 24) compared with WT siblings (n = 24) (t-permutation test, P < 0.001) (Left) and that photoconverted mEos3.2-DHPRα1S decays faster in myofibers of stac3−/− expressing stac3NAM (n = 20) compared with expressing stac3WT (n = 20) (t-permutation test, P < 0.001) (Right). (F) Time course of decay of photoconverted mEos3.2-β-dystroglycan in WT siblings (n = 9) and stac3−/− (n = 9) shows that fluorescence decays at the same rate in WT and stac3−/− (t-permutation test, P = 0.86). (G) FRAP analysis of stac3−/− myofibers expressing stac3WT-EGFP (Top) or stac3NAM-EGFP (Bottom) before photobleaching (Left), immediately after photobleaching (Middle), and 30 min after photobleaching (Right). (H) Mean time course of FRAP of stac3−/− myofibers expressing stac3WT (n = 18) and stac3NAM (n = 36). (I, Top) Histogram showing the percentage of the mobile fraction is larger in stac3−/− myofibers expressing stac3NAM compared with stac3WT (t test, P < 0.0001). (I, Bottom) Histogram showing that the rate of recovery following photobleaching is unchanged between stac3−/− myofibers expressing stac3WT and stac3NAM (t test, ***P = 0.9). SEMs are indicated. n.s., not significant. (Scale bars, 2 μm.) |
| Fish: | |
|---|---|
| Observed In: | |
| Stage Range: | Long-pec to Day 4 |