
FIGURE
Fig. S7
Fig. S7
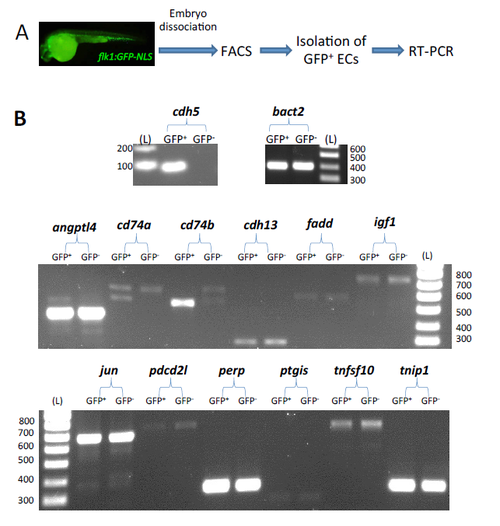
Isolation of ECs from zebrafish embryos and measurement of candidate gene expression by RT-PCR. (A) ECs were isolated from 26 hpf flk1:EGFP-NLS zebrafish embryos using fluorescence-‐activated cell sorting (FACS). (B) Expression of EC marker cdh5, house-‐keeping gene beta-‐actin (bact2) and candidate genes of interest was assessed in ECs (GFP+) by RT-‐PCR followed by analysis of product by gel electrophoresis, while GFP-‐ cells were used as a control. The DNA fragment sizes are indicated in base pairs next to the DNA ladder (L). |
Expression Data
Expression Detail
Antibody Labeling
Phenotype Data
Phenotype Detail
Acknowledgments
This image is the copyrighted work of the attributed author or publisher, and
ZFIN has permission only to display this image to its users.
Additional permissions should be obtained from the applicable author or publisher of the image.
Full text @ Arterio., Thromb., and Vas. Bio.