
FIGURE
Fig. 5
Fig. 5
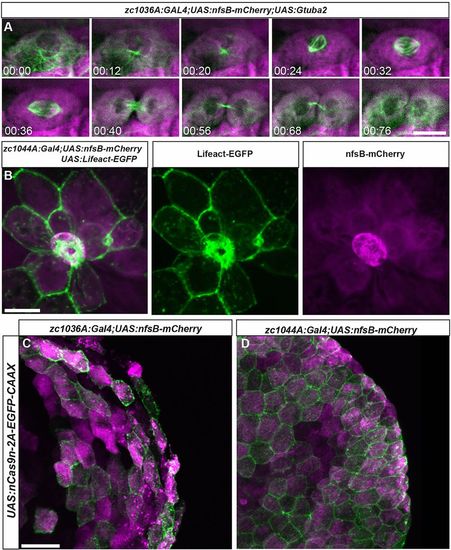
Live imaging of cell division and death in the developing epidermis. (A) Still images from a time lapse movie of cell division in the basal Gal4 line (zc1036A) driving expression of fluorescently labeled microtubules Tg(UAS:Gtuba2). (B) Image of a cell being extruded from the epidermis of a live zebrafish in the periderm Gal4 line (zc1044A) driving expression of fluorescently labeled F-actin Tg(UAS:Lifeact-EGFP). (C,D) Expression of Tg(UAS:nCas9n-2A-EGFP-CAAX) in zc1036A (C) and zc0144A (D) GAL4 lines. Scale bars: 20 μm in A, 25 μm in B, 25 μm in C,D. |
Expression Data
Expression Detail
Antibody Labeling
Phenotype Data
Phenotype Detail
Acknowledgments
This image is the copyrighted work of the attributed author or publisher, and
ZFIN has permission only to display this image to its users.
Additional permissions should be obtained from the applicable author or publisher of the image.
Full text @ J. Cell Sci.