
Fig. S4
- ID
- ZDB-FIG-161227-14
- Publication
- Kawashima et al., 2016 - The Serotonergic System Tracks the Outcomes of Actions to Mediate Short-Term Motor Learning
- Other Figures
- All Figure Page
- Back to All Figure Page
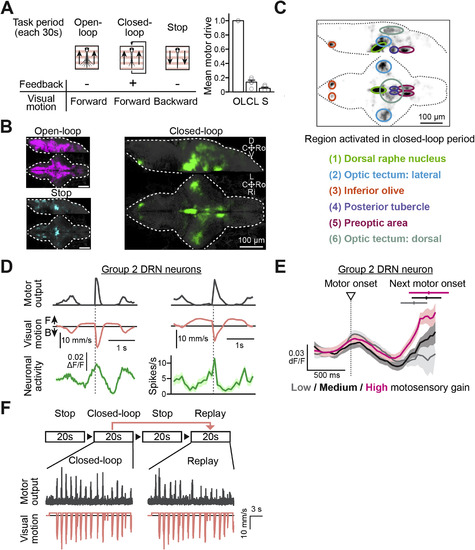
Whole-Brain Map of Neurons that Are Responsive to Closed-Loop Visual Feedback, and Activity Patterns of Group 2 DRN Neurons, Related to Figures 2 and 3 (A) The behavioral task for identifying neurons activated by closed-loop sensory feedback. Left, illustration of the behavioral task. In the ‘open-loop’ period, the visual environment moves forward without any feedback. In the ‘closed-loop’ period, the visual environment moves forward, but when a swim signal is detected it moves backward. In the ‘stop’ period, the visual environment slowly moves backward, during which the fish tend to swim less or cease swimming. Right, normalized locomotor drive in the open-loop (OL), the closed-loop (CL) and the stop (S) period. Locomotor drives of individual fish are normalized to their average locomotor drive in the open-loop period. Error bars represent SEM across 5 fish. (B) Whole-brain maps of neurons that showed highest activity in the open-loop period (magenta, left top), in the closed-loop period (green, right) and in the stop period (cyan, left bottom) morphed and overlaid on a reference brain (gray). n = 5 fish. See the STAR Methods for details of analyses. D, dorsal; V, ventral; Ro, rostral; C, caudal; Ri, right; L, left. (C) Anatomical segmentation of brain regions that showed highest activity in the closed-loop period. Top, the same whole-brain map in (B) inverted for brightness and overlaid with anatomical masks. Bottom, a list of 6 identified anatomical regions. (D) Top, a representative average ΔF/F activity trace (green, bottom left) and a representative electrophysiologically recorded spiking pattern (green, bottom right) from two group 2 DRN neurons recorded separately. Average swim trace is shown in gray (top) and the average visual motion in the virtual reality environment is shown in orange (middle). Gray dotted lines represent the onsets of swim bouts to which the averaged traces are aligned. Shadows represent SEM across averaged swim events. (E) Average ΔF/F activity trace of a representative group 2 neuron in the DRN in response to different motosensory gains during the stochastic gain paradigm. The delayed response is stronger under high motosensory gain (magenta) than under medium (black) or low (dark gray) motosensory gain. The onset time (mean ± SD) of the next swim bout is indicated on the top. For each swim bout, only the activity trace up to the onset of the following bout is included in the average. (F) Behavioral task for desynchronization of swim bouts and visual flow as described in Figure 3B. In the ‘stop’ period of 20 s, the visual motion is stopped. In the ‘closed-loop’ period of 20 s, the visual environment moves forward, but when a swim signal is detected, it moves backward with high motosensory gain. In the ‘replay’ period of 20 s, the same visual motion (orange, bottom) as in the preceding closed-loop period is replayed and the swim events (gray, middle) are desynchronized with visual motion as also shown in Figure 3B. |
Reprinted from Cell, 167, Kawashima, T., Zwart, M.F., Yang, C.T., Mensh, B.D., Ahrens, M.B., The Serotonergic System Tracks the Outcomes of Actions to Mediate Short-Term Motor Learning, 933-946.e20, Copyright (2016) with permission from Elsevier. Full text @ Cell