
Fig. 3
- ID
- ZDB-FIG-161018-3
- Publication
- Lu et al., 2016 - IGFBP1 increases β-cell regeneration by promoting α- to β-cell transdifferentiation
- Other Figures
- All Figure Page
- Back to All Figure Page
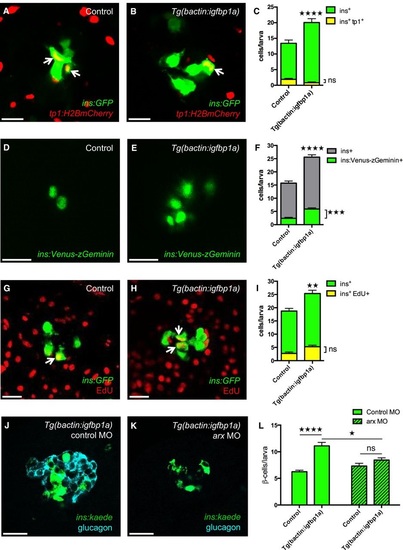
Cellular mechanisms of Igfbp1a′s effect on βcell regeneration A-C. Tg(ins:GFP);Tg(tp1:H2BmCherry);Tg(ins:FlagNTR) transgenics, with or without Tg(bactin:igfbp1a), were treated with MTZ from 3 to 4 dpf to ablate the β cells and were then allowed to regenerate from 4 to 6 dpf. Representative confocal images at 6 dpf of control (A) and Tg(bactin:igfbp1a) (B) larvae showing a modest number of ins+ tp1+ coexpressing cells, indicated by arrows, after 2 days of regeneration. Scale bars: 15 µm. (C) Quantification of the total number of β cells (green bars) at 6 dpf, and of β cells expressing Tg(tp1:H2BmCherry), that is, of ductal origin (yellow bars). ****P < 0.0001, ns= nonsignificant. n = 23 larvae in the control group, n = 17 larvae in the Tg(bactin:igfbp1a) group. D-F. Tg(ins:VenuszGeminin) was examined in control and Tg(bactin:igfbp1a) larvae at 6 dpf, after βcell ablation 3-4 dpf by using Tg(ins:FlagNTR). Representative confocal images (D, E) at 6 dpf of control and Tg(bactin:igfbp1a) larvae showing cell cycle activation of β cells in green. Scale bars: 15 µm. (F) Quantification of the total number of β cells with activated cell cycle at 6 dpf, ***P < 0.001, n = 32 larvae in the control group, n = 41 larvae in the Tg(bactin:igfbp1a) group. The number of β cells with activated cell cycle is displayed together with the total number of β cells in experiments with the same setup, ****P < 0.0001. n = 39 larvae in the control group, n = 33 larvae in the Tg(bactin:igfbp1a) group. G-I. EdU was used as a marker for cell cycle progression. Tg(ins:H2BGFP);Tg(ins:FlagNTR) transgenics, with or without Tg(bactin:igfbp1a), were treated with MTZ from 3 to 4 dpf to ablate their β cells, and subsequently incubated with EdU during regeneration from 4 to 6 dpf. Representative confocal images (G, H) at 6 dpf of control and Tg(bactin:igfbp1a) larvae showing β cells in green and the β cells that had incorporated EdU in yellow (green and red overlap; arrowheads). Scale bars: 20 µm. (I) Quantification of the total number of β cells (green bars) at 6 dpf and of β cells that incorporated EdU (yellow bars) during βcell regeneration from 4 to 6 dpf. **P < 0.01, ns = nonsignificant. n = 16 in both the control and the Tg(bactin:igfbp1a) group.J-L. Tg(ins:kaede);Tg(ins:CFPNTR) transgenics, with or without Tg(bactin:igfbp1a), were injected with a control morpholino or a morpholino that knocked down arx, which is necessary for αcell differentiation and thus glucagon expression (J, K). Scale bars: 20 µm. (L) Quantification of the total number of regenerating β cells at 4 dpf (after βcell ablation at 2-3 dpf). ****P < 0.0001, *P < 0.05, ns=nonsignificant. n = 42, 20, 48 and 20, respectively. |
| Genes: | |
|---|---|
| Antibody: | |
| Fish: | |
| Condition: | |
| Knockdown Reagent: | |
| Anatomical Terms: | |
| Stage: | Day 6 |
| Fish: | |
|---|---|
| Condition: | |
| Knockdown Reagent: | |
| Observed In: | |
| Stage: | Day 6 |