
Fig. 4
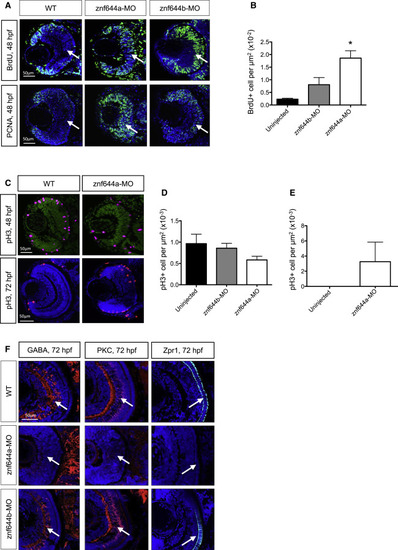
znf644a and znf644b Morphant Retinas Are Composed of Distinct Populations of Retinal Cells with Differing Characteristics (A) Immunostaining of retinal cross-sections monitoring BrdU incorporation and PCNA+ cells at 48 hpf in WT, znf644a, and znf644b morphants. (B) Quantitation of BrdU+ cells/¼m2 in central retina of WT, znf644a, or znf644b morphants at 48 hpf (n = 3 for each group). Error bars represent SD. p < 0.05, Student′s t test. (C–E) Immunostaining of pH3 expression in retinal cross-sections at 48 and 72 hpf in WT, and znf644a morphants (C). Quantitation of pH3+ cells/¼m2 in the central retina of WT, znf644a, or znf644b morphants at (D) 48 hpf (n = 5 for each group) and (E) 72 hpf (n = 2 for each group). Quantitation represented as mean ± SD. (F) Immunostaining monitoring marker protein expression in retinal cross-sections. At 72 hpf, amacrine cells express GABA, bipolar neurons express PKC, and cone photoreceptors express Zpr1. White arrows highlight populations of proliferative or differentiated cells. |
| Antibodies: | |
|---|---|
| Fish: | |
| Knockdown Reagents: | |
| Anatomical Terms: | |
| Stage: | Protruding-mouth |
| Fish: | |
|---|---|
| Knockdown Reagents: | |
| Observed In: | |
| Stage Range: | Long-pec to Protruding-mouth |